CSR

Green Bonds

Focusing on the development of low carbon energy and energy services that enable its customers to reduce their carbon footprint, the Group is firmly committed to contributing to the emergence of the green bond market, which is proving to be one of the most promising investment options in the future to finance the energy transition.


1. Group's Emissions History

Paragraph content

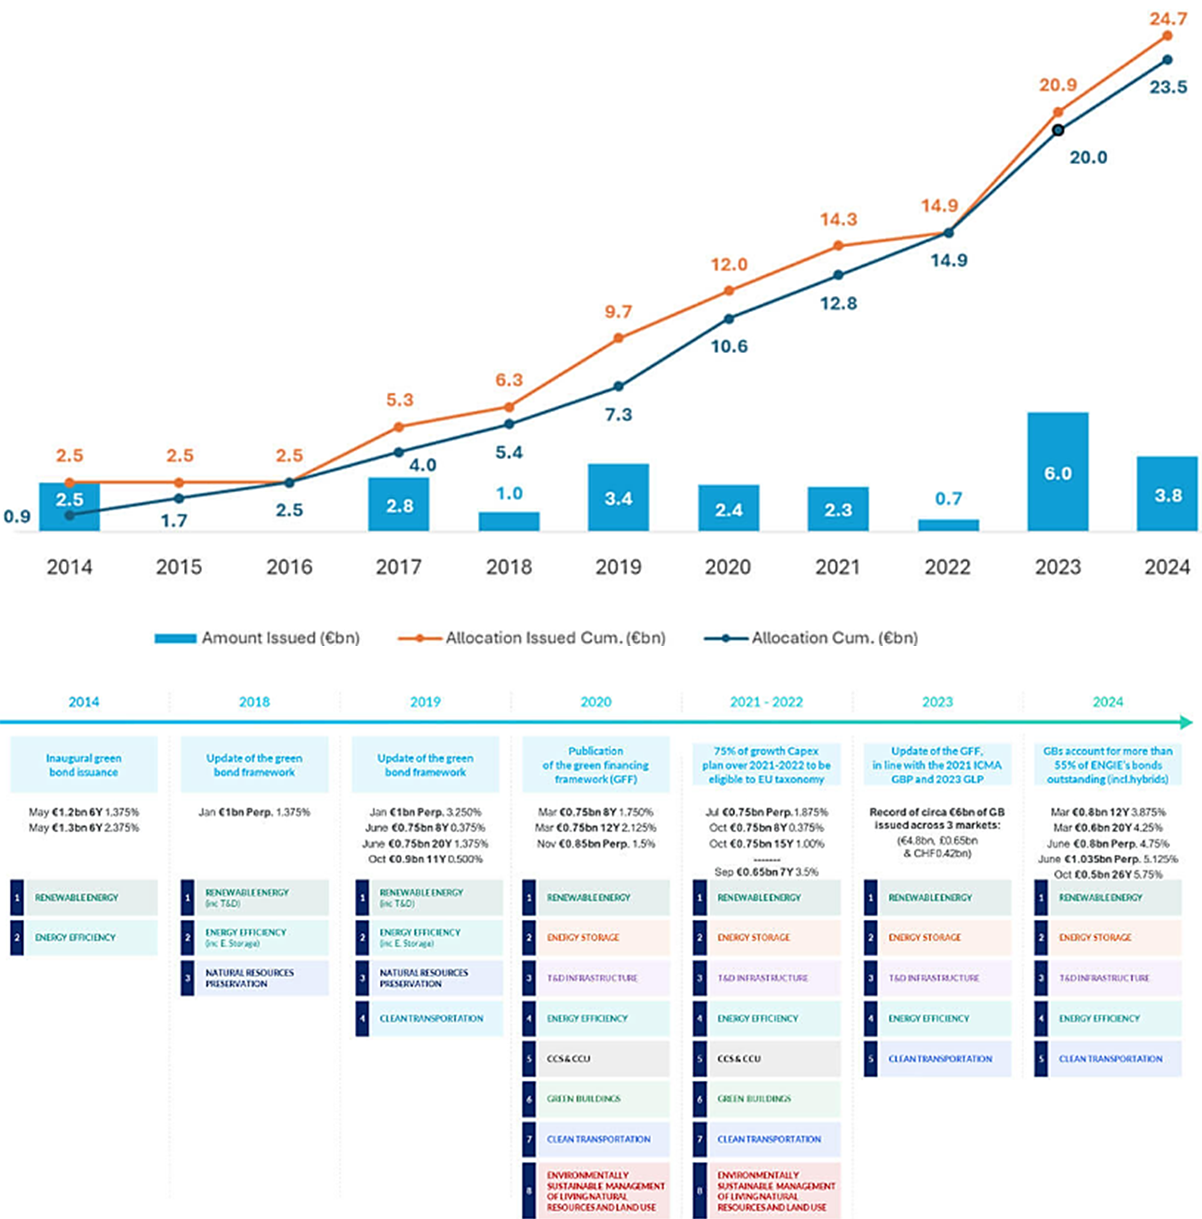
Green Bonds are conventional debt instruments: they are bearer securities, generally listed on a regulated market and with the same level of recourse as the borrower's other senior creditors.  Their special feature relates to the use of the funds raised; the proceeds of these loans are intended to be invested exclusively in so-called "green" projects, generating climate and/or other environmental benefits and also meeting social and societal criteria. ENGIE issued its first green bonds in April 2014, to support its development plan in renewable energies and energy efficiency. At the end of December 2021, ENGIE's total Green Bonds issuance reached €14,25 billion, making the Group one of the leading corporate issuers on the Green Bonds market.

historical issuance and allocation
visual_agenda


The evolution of green bonds issued each year in relation to the Group's total annual issuances is presented below.


Evolution des obligations vertes

Information on the Group's various emissions is available in the Green Finance section.

2. Contribution of funded projects to sustainable development goals

Paragraph content

Since 2017, the Group's Green Bonds comply with the provisions of a general reference framework (Green Bond Framework) that ENGIE has defined for all its green emissions to be made from the date of publication of this Framework. This general framework stipulates, among other things, that for each green bond issue, the funds raised are intended to finance the Group's investments in so-called "eligible" projects, i.e. those that meet the environmental, social and societal criteria listed in this framework and defined in collaboration with the extra-financial rating agency Vigéo Eiris. 


The eligibility criteria have recently been reviewed and published in a new expanded framework ("Green Financing framework") which applies to the Group's green financing issued from March 2020.


Information on the Group's various emissions and their associated framework is available in the Green Finance section


The framework-eligible categories are likely to contribute to five of the United Nations Sustainable Development Goals ("SDGs"), namely: Goal 7. Affordable and clean energy, Goal 9. Industry, Innovation and Infrastructure, Goal 11. Sustainable Cities and Communities, Goal 13. Climate Action, Goal 15. Life on earth


Eligible green projects

The United Nations SDGs identified

United Nations SDG targets

Renewable energy productionSDG 7. Affordable and clean energy7.2 Significantly increase the share of renewable energy in the global energy mix
SDG 13. Climate actionThe UN's SDG 13 is about taking urgent action to combat climate change and its impacts. Businesses can contribute to SDG 13 by reducing GHG emissions through renewable energy projects.
Energy storageSDG 7. Affordable and Clean Energy7.2 Significantly increase the share of renewable energy in the global energy mix
SDG 13. Climate actionThe UN SDG13 is about taking urgent action to combat climate change and its impacts. Businesses can contribute to SDG 13 by reducing GHG emissions through renewable energy storage projects.
Transportation and distribution infrastructureSDG 7. Affordable and Clean Energy 7.2 Significantly increase the share of renewable energy in the global energy mix 
7.3 By 2030, double the global rate of energy efficiency improvement

SDG 13. Climate action

The UN's SDG 13 is about taking urgent action to combat climate change and its impacts. Businesses can contribute to SDG 13 by reducing GHG emissions through renewable energy transmission and distribution projects.

Energy efficiencySDG 7. Affordable and clean energy7.3 By 2030, double the global rate of energy efficiency improvement
SDG 9. Industry, Innovation and Infrastructure9.4 By 2030, upgrade infrastructure and renovation industries to make them sustainable, with increased resource efficiency and greater adoption of clean and environmentally friendly industrial technologies and processes, with all countries taking action in accordance with their respective capabilities
SDG 13. Climate actionThe UN's SDG 13 is about taking urgent action to combat climate change and its impacts. Businesses can contribute to SDG 13 by reducing GHG emissions through energy efficiency projects.
Green buildingsSDG 7. Affordable and clean energy7.3 By 2030, double the global rate of energy efficiency improvement
SDG 13. Climate actionThe UN's SDG 13 is about taking urgent action to combat climate change and its impacts. Businesses can help reduce GHG emissions through green building projects.
Clean transportationSDG 9. Industry, Innovation and Infrastructure9.4 By 2030, upgrade infrastructure and renovation industries to make them sustainable, with increased resource efficiency and greater adoption of clean and environmentally friendly industrial technologies and processes, with all countries taking action in accordance with their respective capabilities
SDG 11. Sustainable cities and communities11.6. By 2030, reduce the negative environmental impact per capita of cities, including by paying particular attention to air quality and municipal and other waste management.
SDG 13. Climate actionThe UN SDG 13 is about taking urgent action to combat climate change and its impacts. Companies promoting clean transportation can help reduce GHG emissions through these projects.
Sustainable management of the environment of living natural resources and land useSDG 15. Life on earth15.1 By 2020, ensure the conservation, restoration and sustainable use of terrestrial and freshwater ecosystems


A Green Bond Committee (recently renamed "Green Financing Committee" or Green Finance Committee, aiming to encompass all green finance subjects in general) meets regularly to discuss market developments and projects likely to be financed by the Green Bond - the so called Eligible Projects. It is chaired by the CSR Department and coordinated jointly with the Finance Department. It includes representatives from the Purchasing Department, the Global Care Department, the Ethics & Compliance Department and the main GBUs concerned.

3. Impact reporting methodology

Paragraph content

Calculation of the contribution of Eligible Projects to avoided or reduced CO2 emissions


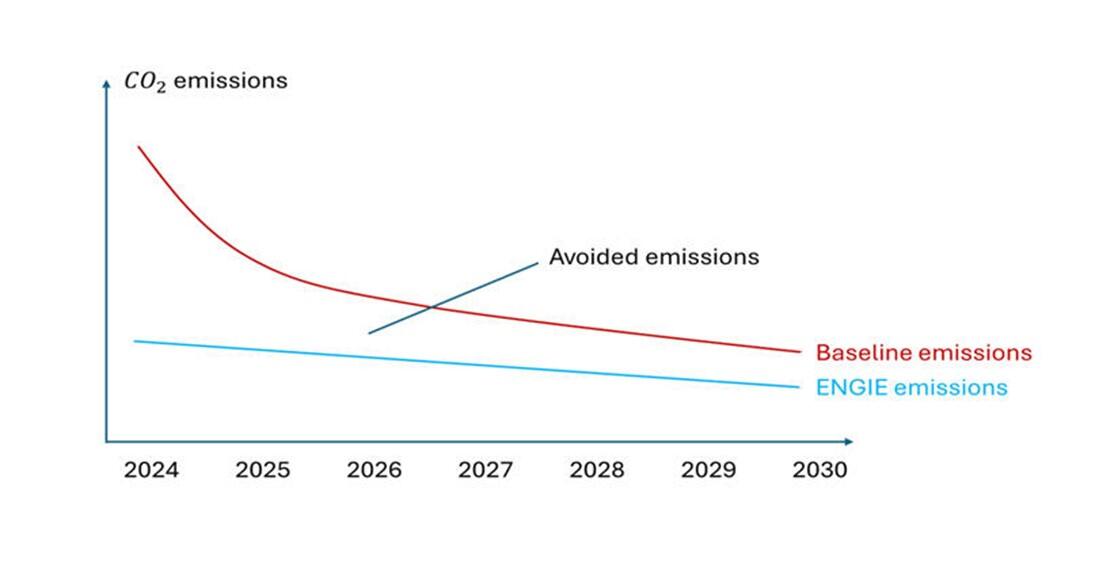
ENGIE uses two concepts: (i) the concept of avoided emissions which concern projects of new installations improving, in relative terms, the carbon footprint of a given country and, (ii) the concept of reduced emissions which concern projects of improvement of existing installations which therefore improve the country's carbon footprint in absolute terms.

Calculation of the contribution of Eligible Projects to avoided or reduced CO2 emissions

For power generation projects, the reference methodology for calculating the contribution to avoided emissions is based on a so-called "LCA" (Life Cycle Assessment) approach. This involves comparing the LCA emissions induced by the energy production technique implemented by the project and the average LCA emissions generated for the mix of the country under consideration. ENGIE evaluates the contribution to avoided emissions of the projects financed by the Green Bond by multiplying the difference of the two LCA values mentioned by the nominal capacity of the plant and the average rate of use of the technology. The avoided emissions are calculated for one year of operation of the projects, considered in the normal operating phase and taken at 100% regardless of the Group's ownership rate in these projects.


Project Contribution to Avoided Emissions =
[(LCA Emission Factor of the country mix) – (LCA Emission Factor of the country mix)] x GW installed x Hour of operation over a year


The references by country for the operating rates of renewable technologies making up the country mix, and the average CO2/kWh emission rates of the energy mix, are taken from data available from Enerdata (Enderdata data). The LCA data for renewable technologies are taken from the work of the Intergovernmental Panel on Climate Change (IPCC data).

LCA emission factor for energy production by country (TCO2/GWh) – data 2018

The methodology for calculating the contribution of these projects to avoided emissions for storage projects is based on a comparison of the emission factors of the energy production technique implemented by the project and the reference scenario. In the case of pumped storage, the gas turbine is taken as the reference.

For the projects involving bioenergy and injection in the network, the quantities of biogas produced and injected into the network are regarded as avoiding an equivalent quantity of energy of the country mix.

To calculate the contribution of energy efficiency projects (including green buildings) to reduced emissions, ENGIE evaluates them by multiplying the energy savings brought by the project by the emissions of the energy mix of the country where the project is developed. Reduced emissions are calculated for one year of operation of the projects, considered in the normal operating phase and taken at 100% regardless of the Group's ownership of these projects.


Project Contribution to Reduced Emissions = LCA Emission Factor Emissions of the country mix x GWh of energy savings


For heating network facilities fueled by biomass, ENGIE multiples the energy savings generated by the projects by the natural gas emission factor. Reduced emissions are calculated for one year of operation of the projects, considered in the normal operating phase and taken at 100% regardless of the Group's ownership of these projects.

4. Allocations to the Green Bonds of October 2021 and September 2022

Paragraph content

PROJECTS AND ELIGIBILITY CRITERIA

The categories of projects covered by the Green Financing Framework of March 2020 are described below:

  • renewable energy production (hydropower, geothermal energy, wind, solar, bioenergy, low- carbon hydrogen, marine energy);
  • energy storage (electricity storage by pumped storage and batteries);
  • electricity transmission and distribution infrastructure;
  • energy efficiency (including district heating network and cooling);
  • carbon capture and storage;
  • green buildings;
  • clean transportation (including electric charging stations);
  • sustainable management of living natural resources and land use.


The technical eligibility criteria for the different categories of the Green Financing Framework are available on ENGIE’s website


The Green Bond Committee was established in 2017. This Committee meets regularly to review market developments and Green Eligible Projects and to approve the allocation of the Green Bonds. It is jointly led by the CSR Department and the Finance Department and brings together the procurement Department, the Global Care Department and the main GBU concerned.


It has to be noted that a new Green Financing Framework has been published in June 2023. The 2022 allocation was done under the Green Financing Framework of March 2020.


NEW ALLOCATIONS

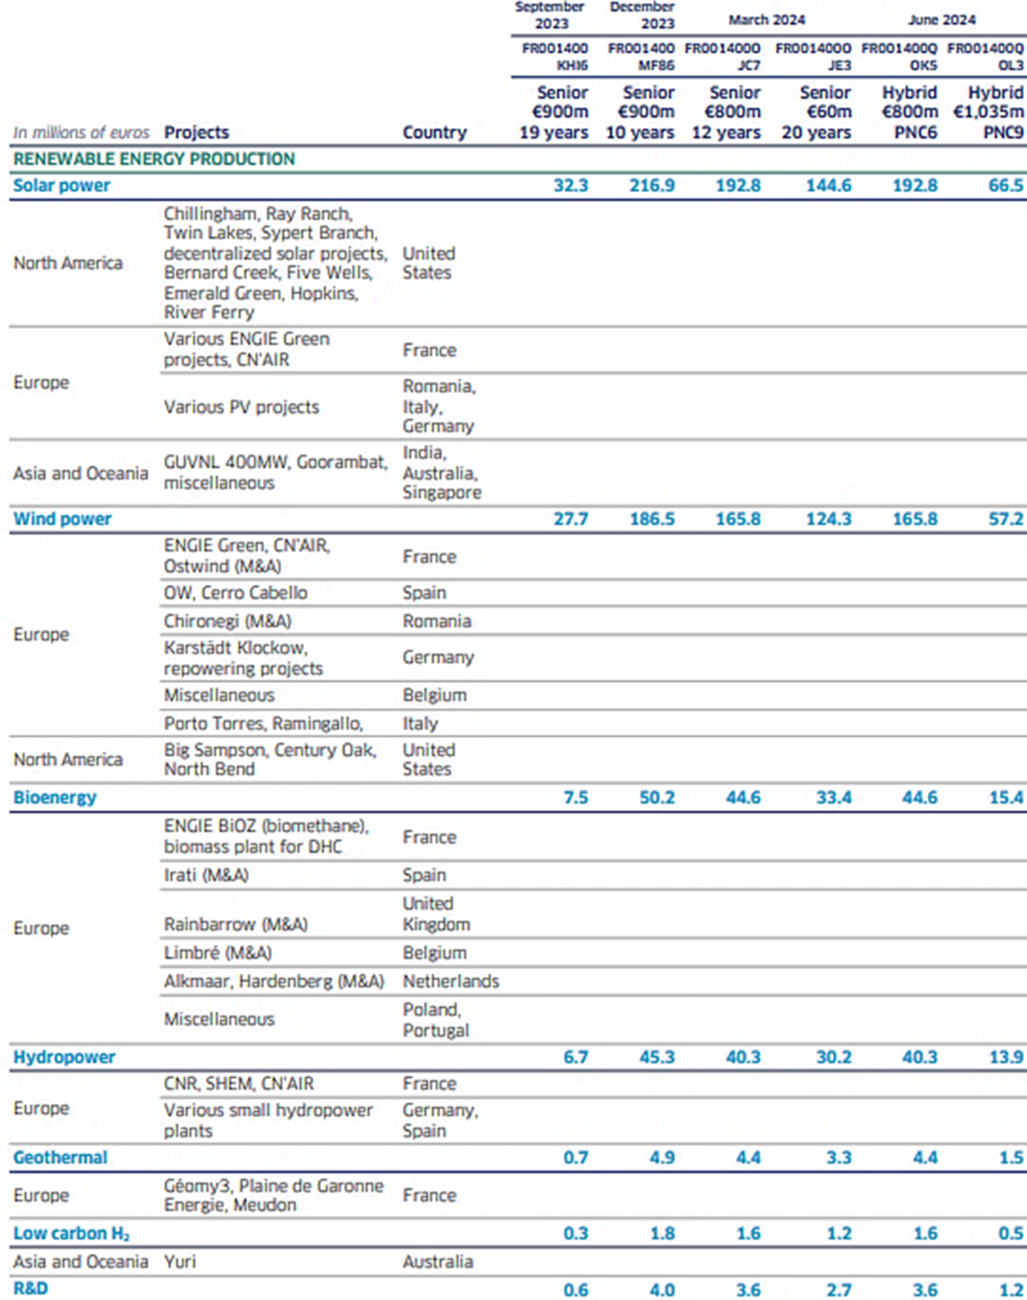
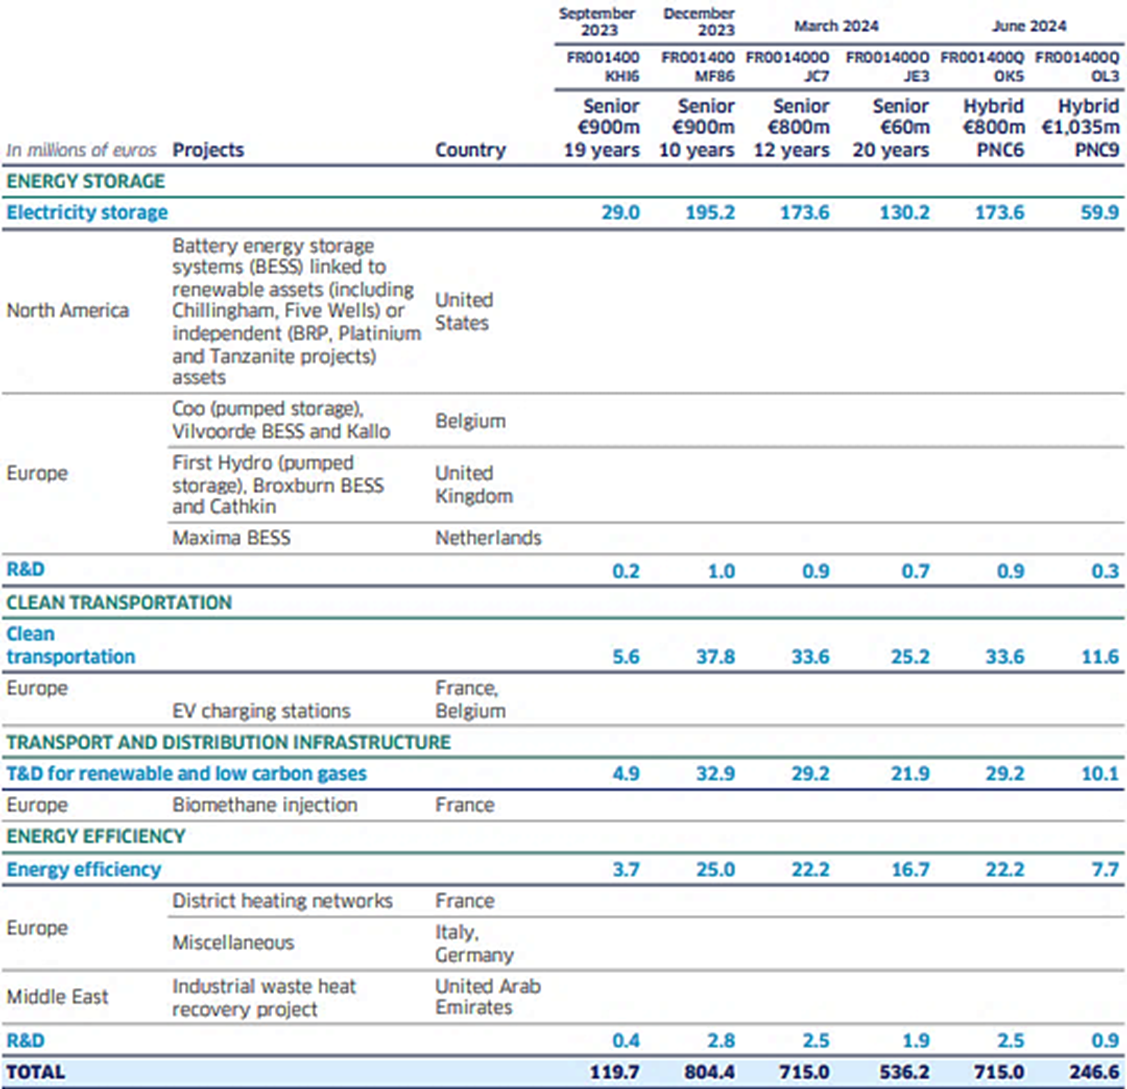
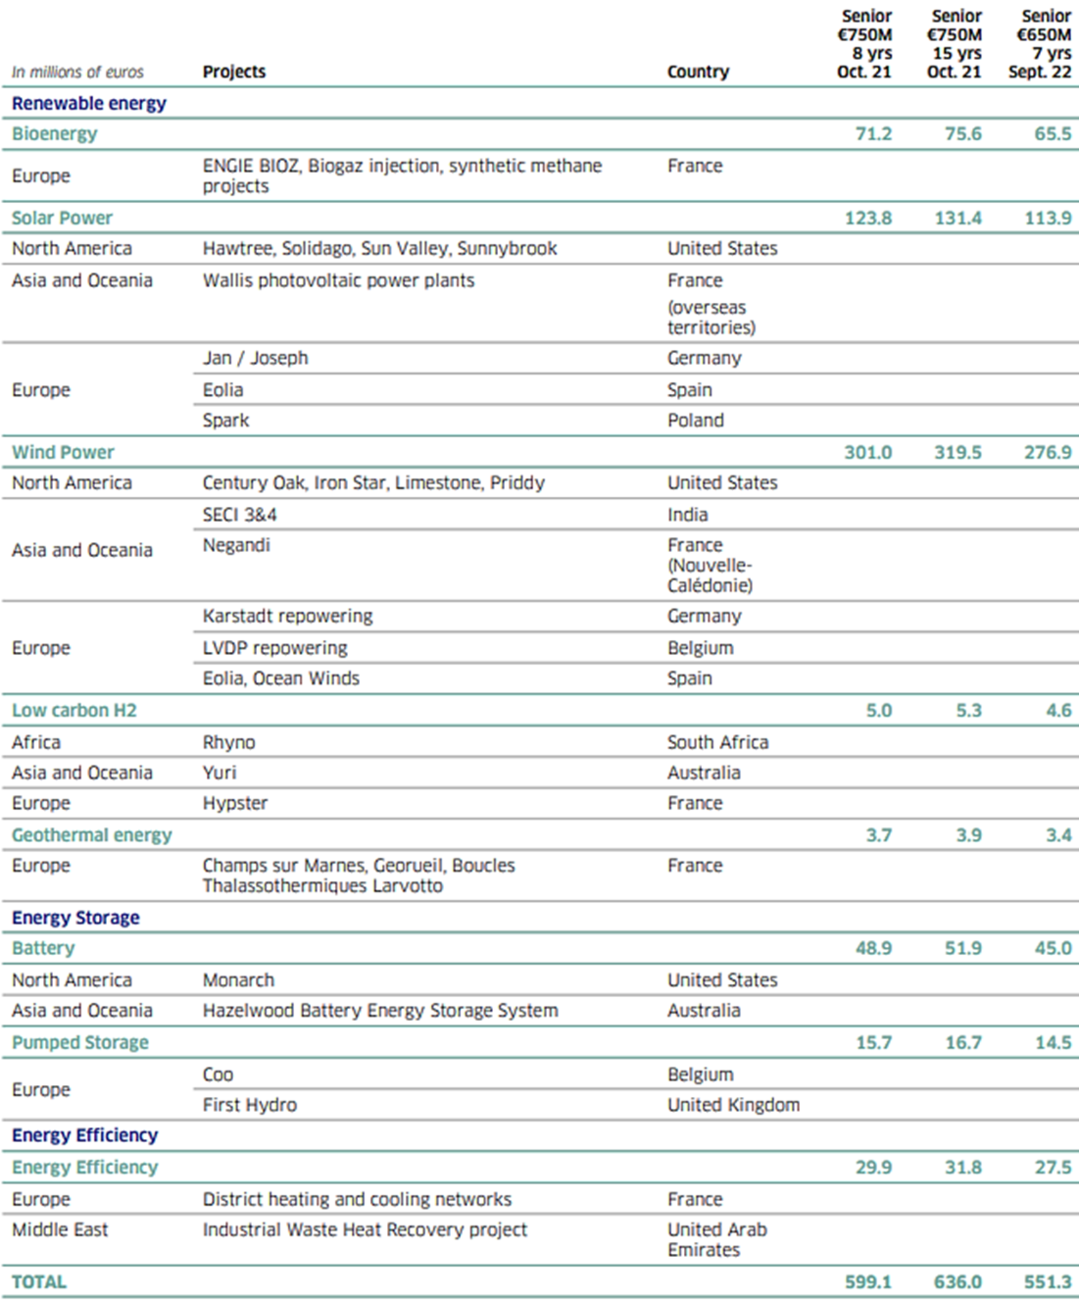
The main Green Eligible Projects financed by the Green Bond issues of October 2021 (ISIN: FR0014005ZP8 and FR0014005ZQ6) and of September 2022 (ISIN: FR001400A1H6) that meet the aforementioned conditions of the Green Financing Framework are listed in the table below:

new allocations

The funds allocated to Green Eligible Projects throughout 2022 relate solely to investments made in the same year.
The retained allocations contribute to the funding or acquisition of Green Eligible Projects in:

  • renewable energy (wind power, solar power, bioenergy, low carbon hydrogen, and / or geothermal energy);
  • energy storage;
  • energy efficiency.


1)    Renewable Energy

Energy transition and the development of renewable energy on a global scale are a strategic priority for ENGIE. In 2021, the Group set itself the target of stepping up its investments in renewables to enable it to install 3 GW of additional capacity in 2021, then 4 GW per year on average from 2022 to 2025, and finally 6 GW per year from 2026. The Group’s installed electricity production capacity, taken at 100% for its renewables production businesses, reached 38 GW in 2022, accounting for 38% of its installed capacity. ENGIE is targeting a 58% share of renewable energy installed capacity in its electricity production portfolio taken at 100% by 2030. In 2022, ENGIE continued to expand its portfolio of renewable assets, mainly in wind and solar by developing new projects in particular in North America, South America and Europe. At the beginning of May 2022, the Group and its partner Crédit Agricole Assurances finalized the acquisition of Eolia, a major Renewables player in Spain, adding 0.9 GW of assets in operation and 1.2 GW of additional projects to ENGIE’s platform in Iberia. Investments in offshore wind continued via the joint venture Ocean Winds. In France, the Group, through ENGIE BIOZ, and its infrastructure business lines, also pursued its efforts to develop the sector of methanization of waste into renewable gases and to recover them through injection into the natural gas transmission and distribution network.
These low-carbon resources play an essential role in energy transition and the fight against climate change.
During 2022, a total of €1.50 billion had been allocated to Green Eligible Projects in the field of renewable energy in respect of the Green Bonds of October 2021 (8 year and 15 year tranches) and September 2022 (7 year tranche).


2)    Energy storage

Energy storage solutions play a major role in the energy transition and are an essential link in the electricity networks.
By storing energy produced at times when wind and solar sources are at their most productive, and / or when demand is lowest, they respond to the need to balance intermittent supplies of renewable energy, which make up an increasing proportion of energy production. ENGIE invests in pumped storage and battery storage for this reason.
The Green Eligible Projects in question include:

  • the Dinorwig (1,728 MW) and Ffestiniog (360 MW) pumped storage facilities in the United Kingdom, owned and operated by First Hydro, which is 75% owned by ENGIE;
  • the Coo pumped storage plant (Belgium) where investments are being made to expand its storage facilities in order to increase its installed power by 79 MW;
  • the power battery storage project at Hazelwood in Australia;
  • the acquisition of a pipeline of development projects in solar energy and paired and stand-alone battery storage from Belltown Power U.S. in the United States (Monarch transaction). The transaction covers 33 projects, including 0.7 GW of paired storage and 2.6 GW of stand-alone battery storage.


During 2022, a total amount of €192.6 million was allocated to Green Eligible Projects developed in the field of energy storage in respect of the Green Bonds of October 2021 (8 year and 15 year tranches) and September 2022 (7 year tranche).


3)    Energy Efficiency

Another strategic focus of the Group is the development of high efficiency energy networks supporting the transition to a low-carbon economy. In 2022, ENGIE continued to develop urban heating or cooling networks in Europe and mainly in France.
During 2022, a total of €89.3 million had been allocated to Green Eligible Projects in the field of energy efficiency in respect of the Green Bonds of October 2021 (8 year and 15 year tranches) and September 2022 (7 year tranche).


IMPACT REPORTING

The impact reporting only takes into account the new projects allocated in 2022. Reallocated projects following the buyback of previous issues are not taken into account in the impact reporting.
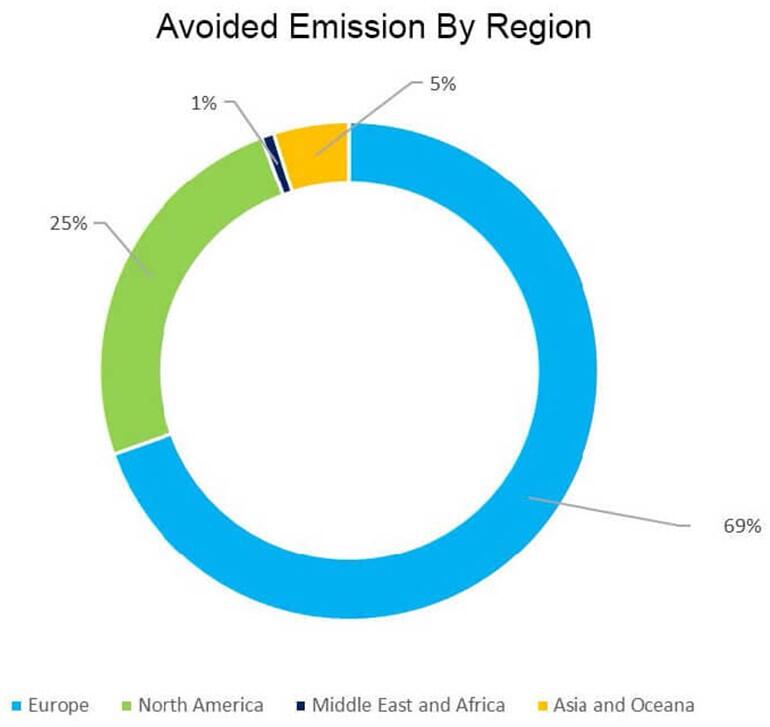
In the full operation phase, the projects are expected to contribute to avoid emissions of 3.8 million tons of CO2eq per year:

(i)    for renewable projects, 3.35 million tons of CO2eq/year,
(ii)    for energy efficiency projects, 0.45 million tons of CO2eq/year
(iii)    for storage projects, 0.016 million of CO2eq/year.

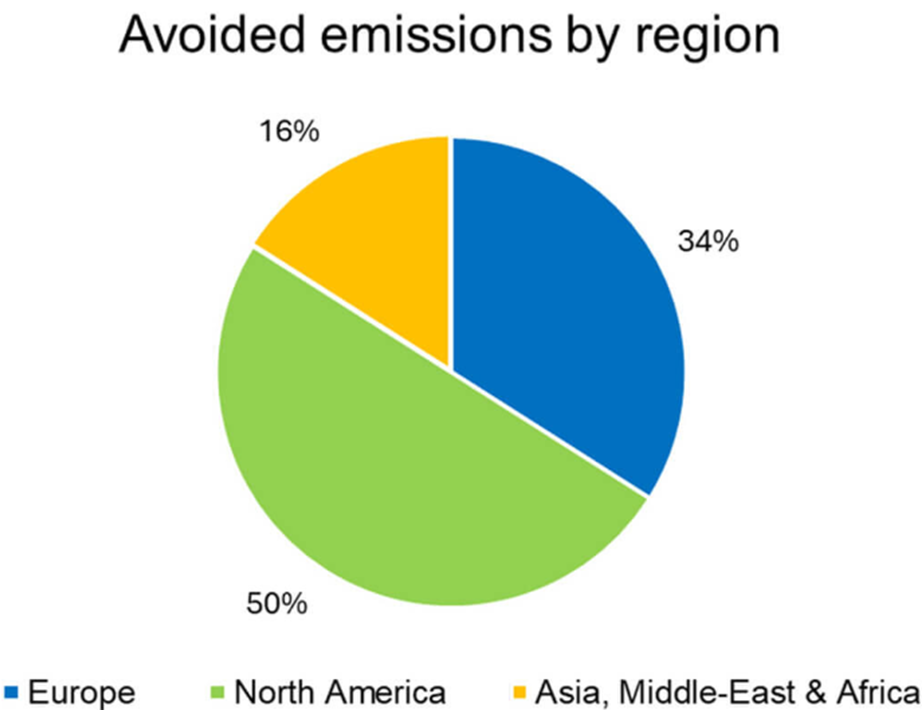
The breakdowns by technology and by region of the impacts in tons of CO2 eq per year of the projects are presented below (at 100%).


METHODOLOGY

Renewable Energy

When fully operational, renewable energy projects should contribute to avoiding greenhouse gas emissions by a minimum of 3.35 million metric tons of CO2 eq. per year.
The methodology for calculating avoided emissions is based on a comparison of the Life-Cycle Analysis (LCA) emission value of the energy generation technology being used by the project and the one of the energy mix of the country in question. ENGIE estimates the contribution to avoided emissions resulting from Green Bond-funded projects by multiplying the difference between the two LCA values stated with the plant’s capacity and the technology’s average load factor. The contribution to avoided emissions are calculated for one year of operation of the projects, considered in a full operational mode and taken at 100% regardless of the Group’s ownership rate of these projects.
Per-country reference data for the average operating rates of technologies used and the average CO2 emissions rates per kWh of the generation mix were drawn from data from Enerdata. The technologies’ LCA data is derived from work performed by the Intergovernmental Panel on Climate Change (IPCC). For the projects involving bioenergy and injection in the network, the quantities of biogas produced and injected into the network are regarded as avoiding an equivalent quantity of energy of the country mix.


Energy storage

When fully operational, energy storage projects should contribute to reducing greenhouse gas emissions by a minimum of 0.016 million metric tons of CO2 eq. per year. The methodology for calculating the contribution to avoided emissions for storage projects is based on a comparison of the emission factors of the energy production technique implemented by the project and the reference scenario. In the case of pumped storage, the gas turbine is taken as the reference. ENGIE estimates the contribution to avoided emissions of Green Bond-funded projects by multiplying the difference between the above emission factors by the average production of the facilities. The contribution to avoided emissions are calculated for one year of operation of the projects, considered in a full operational mode and taken at 100% regardless of the Group’s ownership rate of these projects.


Energy Efficiency

When fully operational, these projects should contribute to reducing greenhouse gas emissions by a minimum of 0.45 million metric tons of CO2 eq. per year. The calculation of avoided emissions is done by comparing the level of emissions of ENGIE projects with a reference scenario, in this case the use of an individual gas heating system when it comes to a district heating network, or individual air conditioning in the case of a district cooling network. The contributions to avoided emissions are calculated for one year of operation of the projects, considered in a fully operational mode and taken at 100% regardless of the Group’s ownership rate of these projects.

avoided emissions

The contributions to avoided emissions are presented in the following table using different weighting methods: a) at 100% regardless of the Group’s ownership rate and regardless of the nature of the capex (financial or development), b) according to the Group's ownership rate and regardless of the nature of the capex (financial or development), c) considering only the development capex regardless of the Group’s ownership rate (at 100%), and finally d) according to the Group's ownership rate and taking only the development capex.


Avoided CO2 emissions (TCO2eq/year) by technology


(a) linked to development and financial CAPEX taken at 100%

b)    linked to development and financial CAPEX taken at % of ownership


c)    linked to development CAPEX taken at 100%


d)    linked to development CAPEX taken at
% of ownership

Wind power2,434,1471,487,517700,393363,956
Solar Power389,914264,164360,319234,569
Energy
efficiency
454,390376,140454,390376,140
Bioenergy505,552399,468500,844396,512
Hydrogen8,6788,6788,6788,678
Energy storage15,75015,75015,75015,750
Geothermal8,6008,6008,6008,600
Grand Total3,817,0312,560,3172,048,9741,404,205


5. Allocations to the Green Bonds of March, November 2020 and July 2021

Paragraph content

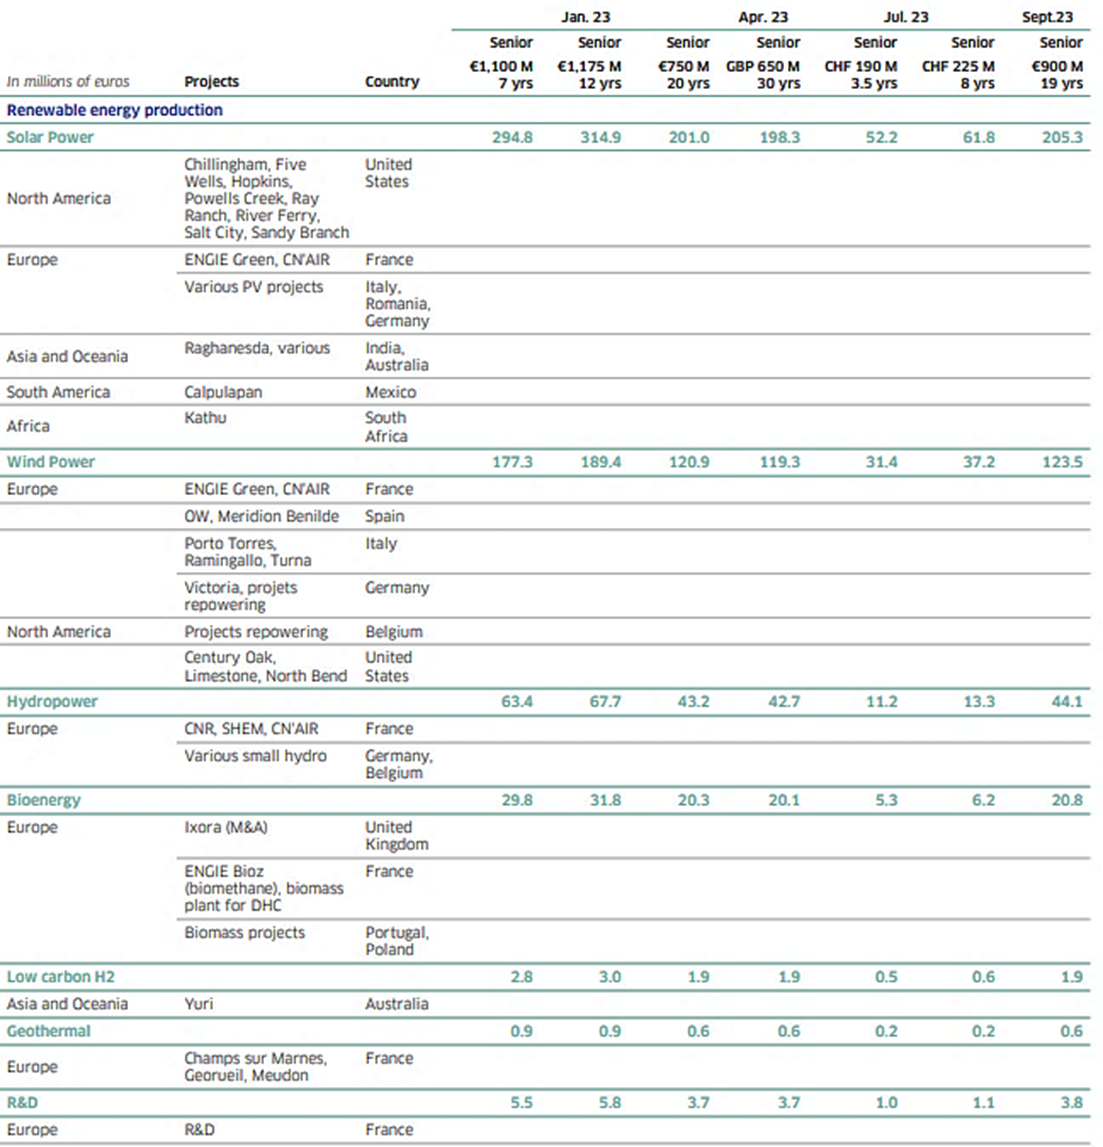
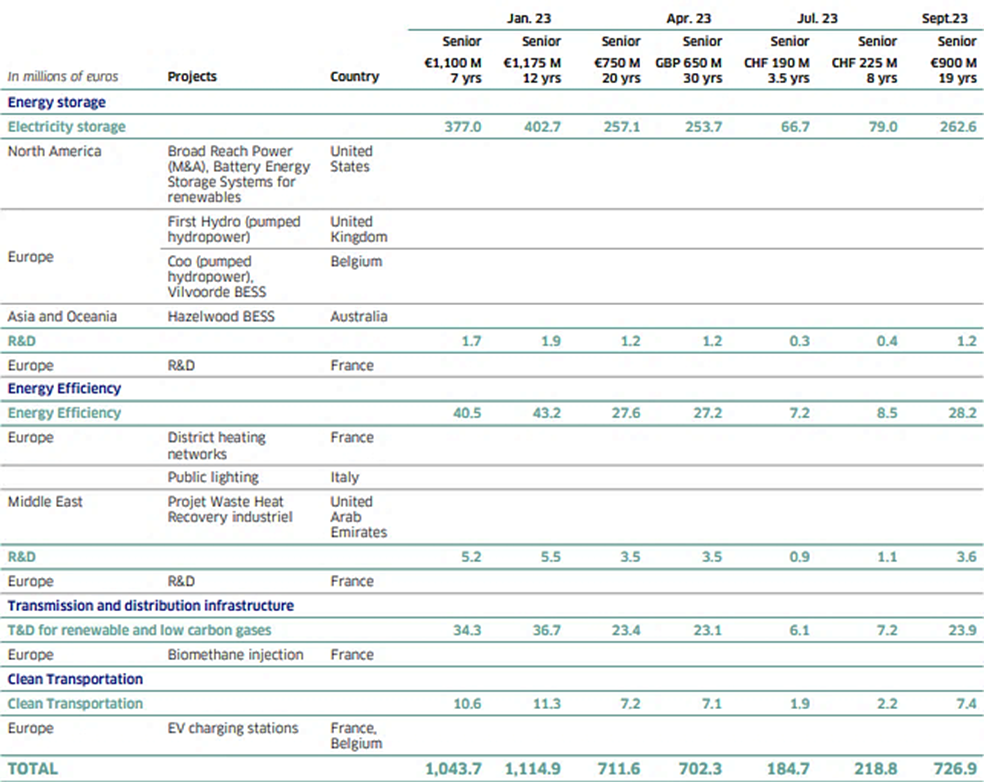
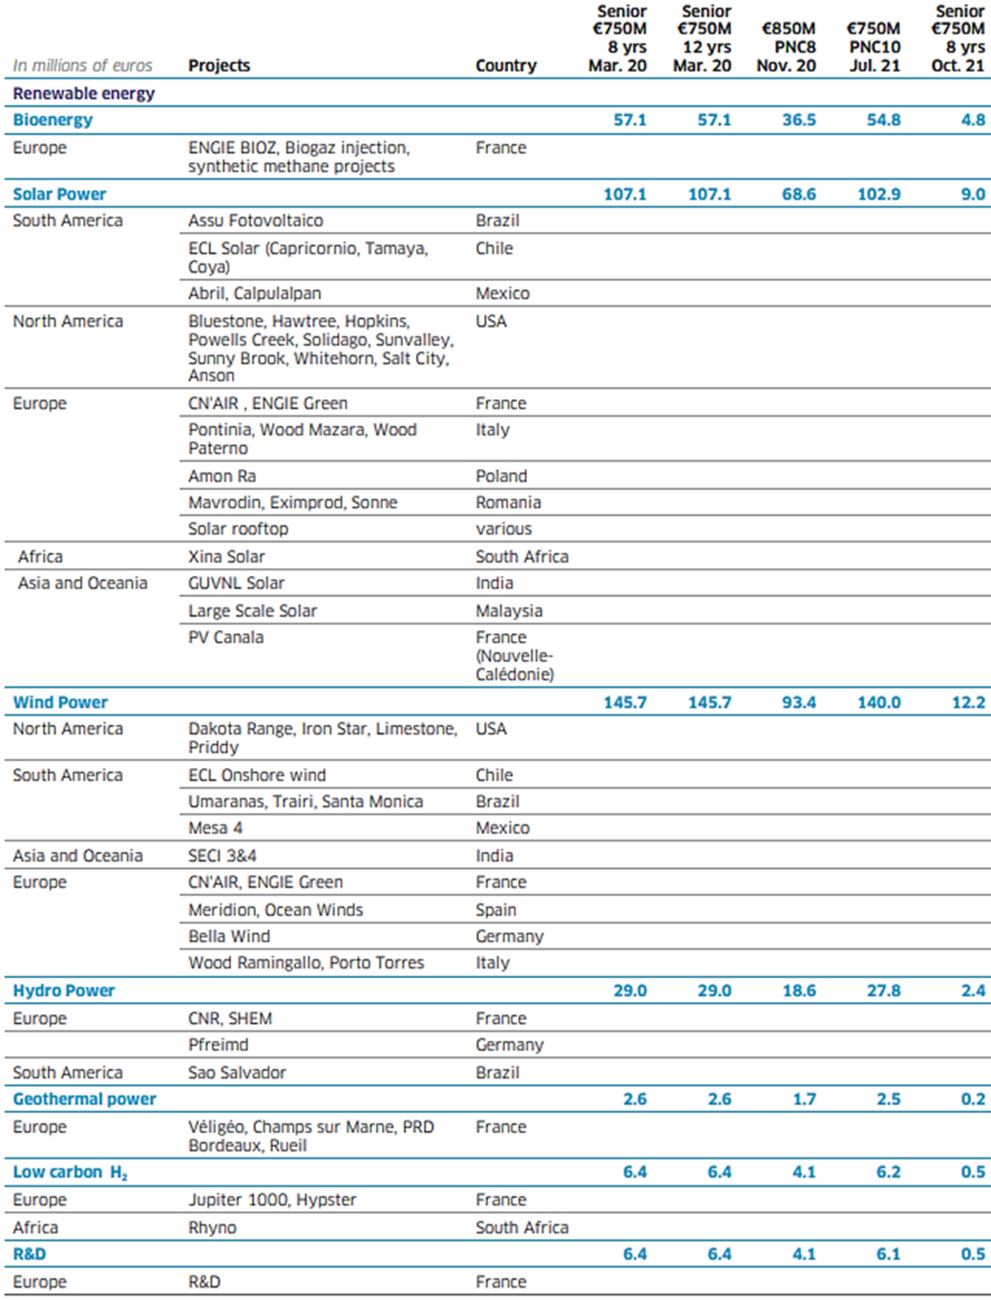
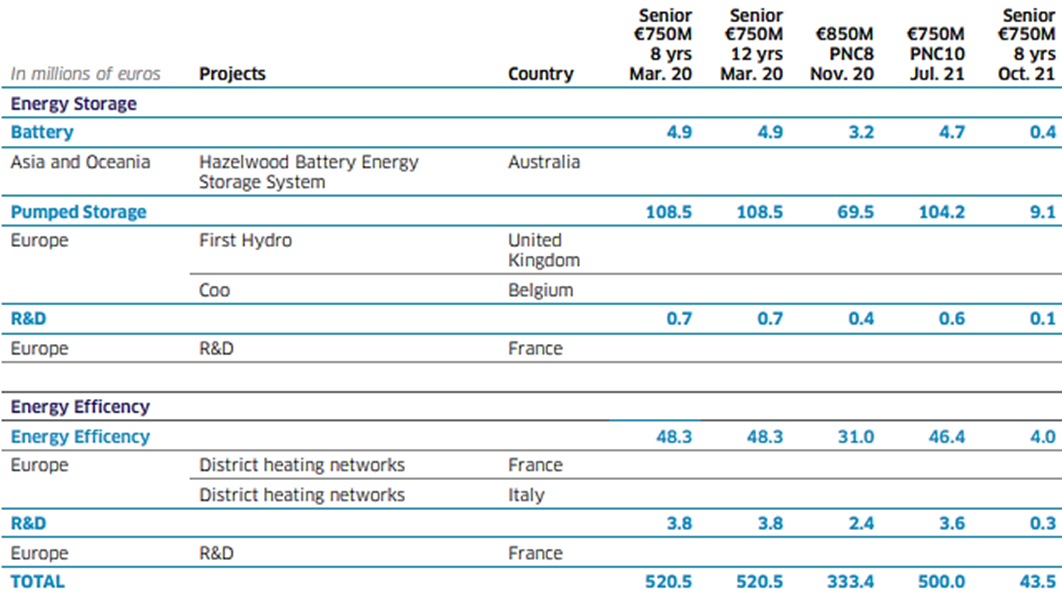
The main Eligible Projects that were financed in 2021 with the proceeds of the March, November 2020 and July 2021 Green Bond issues that comply with the ENGIE Green Finnancing Framework are presented in the following table.

tableau1

In 2021, ENGIE continued to expand its portfolio of renewable assets, mainly in wind, solar and geothermal by developing new projects in particular in North America, South America and Europe. In France, the Group, through ENGIE BIOZ, and its infrastructure business lines, pursued its efforts to develop the sector of methanization of waste into renewable gases and to recover them through injection into the natural gas transmission and distribution network. These low-carbon resources play an essential role in energy transition and the fight against climate change

tableau2

In 2021, ENGIE continued to develop urban heating or cooling networks in Europe and mainly in France. In the United States, ENGIE has entered into a partnership with the University of Georgetown (Washington DC) for the management of energy infrastructure and campus techniques with ambitious targets in terms of sustainable development and energy savings. For the entire duration of the agreement, ENGIE will be responsible for improving, operating and maintaining electrical, heating, cooling and water distribution systems, with a target of reducing energy intensity by 35% by 2030


Impact Reporting

The impact reporting only takes into account the new projects presented in the table above. Reallocated projects following the buyback of previous issues are not taken into account in the impact reporting.
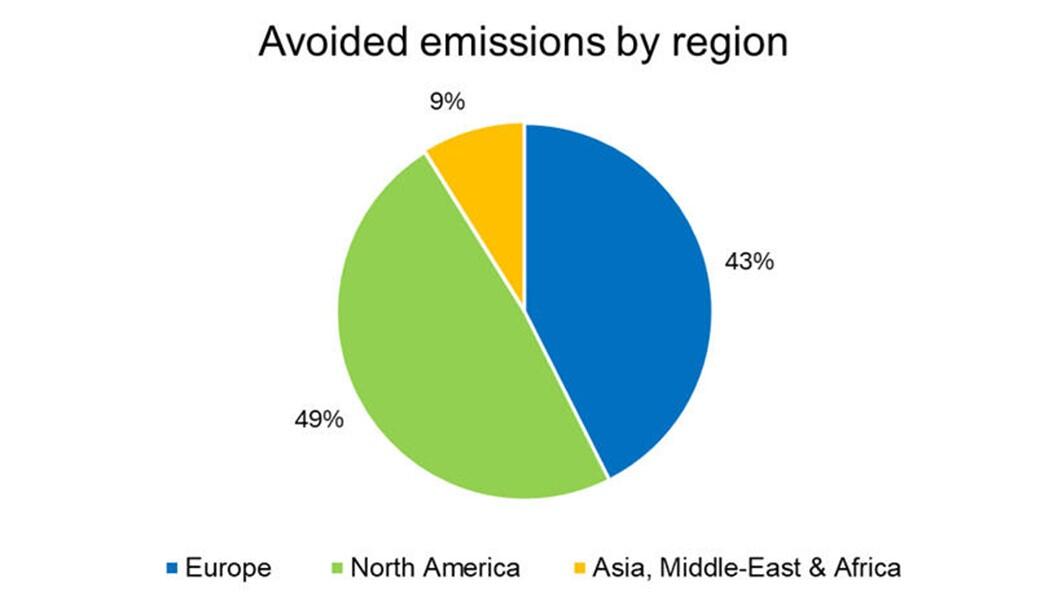
In the full operation phase, the projects are expected to contribute to avoid emissions of at least 4.54 million tons of CO2eq per year: (i) for renewable projects, a minimum of 4.12 million tons of CO2eq/year, (ii) for energy efficiency projects, 0.38 million tons of CO2eq/year, and (iii) for storage projects, 0.04 million of CO2eq/year.

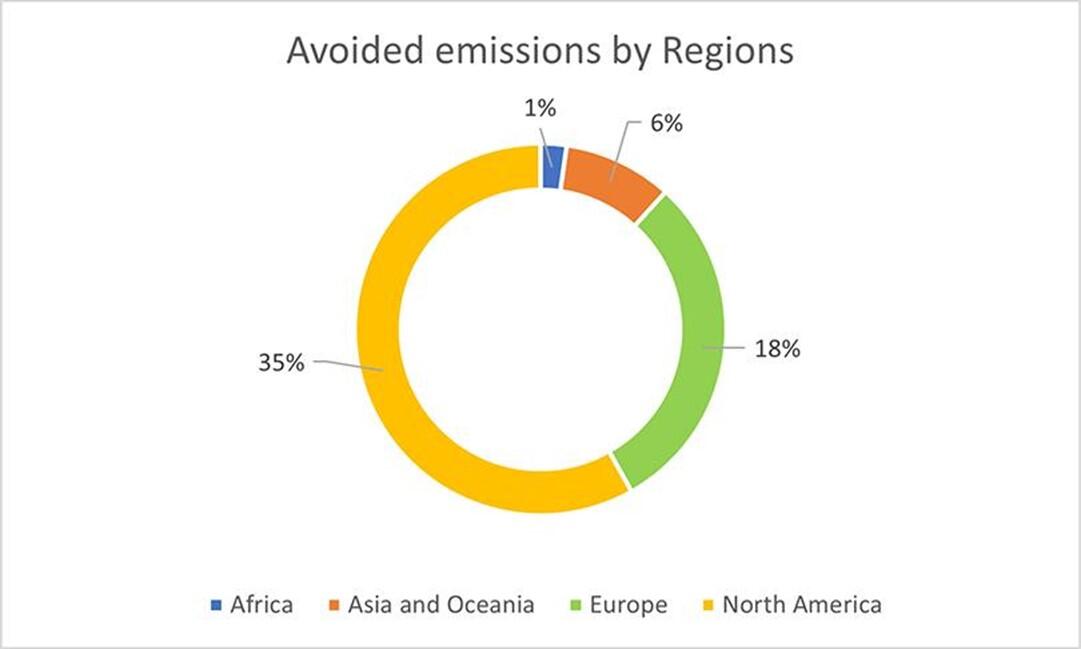
The breakdowns by technology and by region of the impacts in tons of CO2 eq per year of the projects financed by the Green Bond of March, November 2020 and July 2021 are presented below (at 100%)

graph 1
graph 2

The contributions to reduced or avoided emissions are presented in the following table using different weighting methods: a) at 100% regardless of the Group’s ownership rate and regardless of the nature of the capex (financial or development), b) according to the Group's ownership rate and regardless of the nature of the capex (financial or development), c) considering only the development capex regardless of the Group’s ownership rate (at 100%), and finally d) according to the Group's ownership rate and taking only the development capex.


Avoided and reduced CO2 emissions (TCO2eq/year) by technology
 (a) linked  to development and financial CAPEX taken at 100%b) linked  to development and financial CAPEX taken at % of ownershipgc) linked  to development CAPEX taken at 100%d) linked  to development CAPEX taken at % of ownershipg
Wind power2.287.6161.384.2462.287.6161.384.246
Solar Power1.471.779994.2811.404.808962.933
Energy efficiency377.626346.899328.055328.042
Bioenergy358.800310.125358.800310.125
Hydrogen2.2872.2872.2872.287
Pumped Storage12.12412.12412.12412.124
Battery30.94721.66330.94721.663
Hydro power353177353177
Grand Total4.541.5323.071.8024.424.9903.021.596


6. Allocations to the Green Bonds of June and october 2019

Paragraph content

The main Eligible Projects that were financed in 2020 with the proceeds of the June and October 2019 Green Bond issues are presented in the following table. 


In millions of eurosProjectsCountrySenior €750 m
8 Y Jun 19

Senior  €750 m 20 Y Jun 19

Senior  €900 m 11 Y Oct 19
Type of Project: Renewable Energy
Technology: Hydropower 201205246
EuropeMonet*Portugal
CN'AIR Hydro*France
Technology: Solar 201204245
South AmericaCapricornio, TamayaChili
Abril, Calpulalpan, Sol de Insurgentes, Villa AhumadaMexico
SD ParacatuBrazil
North AmericaAnson, Bluestone, Long Draw, Whitehorn (Gretna), Hawtree*United States
EuropeCN'AIR Solar, Engie Green, Développement PV E&C*France
Sonne PV*Romania
AfricaFenixSeveral countries (1)
Scaling SolarSénégal
Asia and OceaniaGUVNLIndia
RetopChina
Middle EastNadecSaudi Arabia
Technology: Wind 194196237
North AmericaDakota Range, East Forks, Iron Star*, Jumbo Hill, King Plains, Las Lomas,  Prairie Hill, Solomon Forks, Triple H, Priddy*United States
South AmericaCalamaChili
Tres Mesas 4Mexico
EuropeOW*, CN'AIR Wind, Engie Green On-shore, Renvico*, ABOWind*France
Renvico*, Wood*Italy
Technology: Bioenergy 222327
EuropeGRDF (Injection de biogaz dans le réseau), Engie BiOZ, DSP Pau*France
Technology: Geothermal 444
EuropeChamps sur Marne*, Vélidis*France
Asia and OceaniaSupreme Muara LabohIndonesia
Technology: R&D 9911
Type of Project: Energy Efficiency
Technology: Energy efficiency 777894
EuropeGazpar, Réseaux de Chaleur Urbains, Storengy (projets Hydrogen et synthetic methane)*France
GAMOR*Germany
ENGIE New VenturesSeveral countries
Asia and OceaniaPunggol DCS*Singapore
Technology: Pumped Storage 141518
EuropeFirst Hydro (Ffestiniog 1&2)*United Kingdom
Technology: R&D 555
Type of project: Clean Transportation
Technology: Clean Transportation 567
EuropeGNVERT*France
Technology: EV 333
Asia and OceaniaEVChong*China
Technology: Hydrogen 222
AfricaRhyno*South Africa
EuropeDMSE*, Zero Emission Valley*France
SUB-TOTAL 737750900
 
ALLOCATED IN 2019     
Type of project: Clean Transportation
Technology: EV 13--
EuropeChargePointUnited Kingdom
TOTAL 750750900
* New eligible projects
(1) Uganda, Zambia, Benin, Nigeria, Mosambique

Description of the projects

The main projects concern the development of solar and wind farms in Europe, South and North America (Website of wind and solar projects in the US ). The group also acquired 2 GW of renewable capacity in operation through the acquisition in Portugal of hydraulic dams owned by EDP (Press release )  as well as wind parks of Renvico (Press release ) The  energy efficiency  allocations relate to projects related to the development of heat and smart metering networks in France, as well as the extension of the pump storage stations in England (Pump storage refurbishment)


Impact Reporting 

In the full operation phase, the projects are expected to contribute to avoid emissions of at least 5.26 million tons of CO2eq per year: (i) for renewable projects, a minimum of 5.05 million tons of CO2eq/year, (ii) for energy efficiency projects, 0.21 million tons of CO2eq/year, and (iii) for clean transportation projects, around half thousand ton of CO2eq/year.

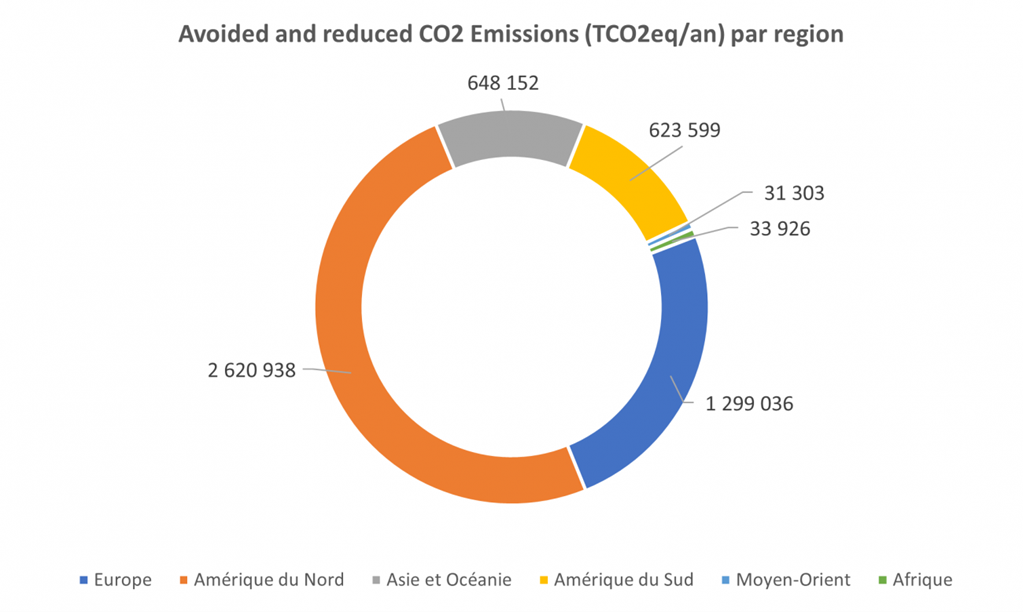
The breakdowns by technology and by region of the impacts in tons of CO2 eq per year of the projects financed by the Green Bond of June and October 2019 are presented below (at 100%)

Avoided and reduced CO2 emissions (TCO2eq/an) by technology
Avoided and reduced CO2 Emissions (TCO2eq/an) par region

The contributions to reduced or avoided emissions are presented in the following table using different weighting methods: a) at 100% regardless of the Group’s ownership rate and regardless of the nature of the capex (financial or development), b) according to the Group's ownership rate and regardless of the nature of the capex (financial or development), c) considering only the development capex regardless of the Group’s ownership rate (at 100%), and finally d) according to the Group's ownership rate and taking only the development capex.

Avoided and reduced CO2 emissions (TCO2eq/year) by technology
 (a) linked  to development and financial CAPEX taken at 100%b) linked  to development and financial CAPEX taken at % of ownershipgc) linked  to development CAPEX taken at 100%d) linked  to development CAPEX taken at % of ownershipg
Wind2,682,561 1,407,727 2,591,355 1,388,979
Solar962,585 711,402  959,078 707,895
Hydro906,769 362,72113065
Geothermal430,848 154,243 5,302 5,302
Energy efficiency187,586 159,617187,586159,617
Bio energy67,120 65,43967,120 65,439
Pump storage19,067 14,30019,067 14,300
Clean mobility298298298298
Electric vehicles11936--
Hydrogen----
Total5,256,954 2,875,783 3,829,935 2,341,895

7. January 2019 Green Bond Allocations

Paragraph content

The main Eligible Projects that were financed in 2019 with the proceeds of the January 2019 Green Bond issue are presented in the following table. 


Project typeTechnologyRegionProjects nameCountryCAPEX (in million euros)
RenewableWindEuropeProjects of CN’AIR, ENGIE Green, LANGA et Saméole France451
WindfloatPortugal
North AmericaKing Plains, Las Lomas, Live Oak(1), Dakota Range III, Prairie Hill, Triple H, Solomon Forks(1) United States
Asia and OceanieWillogeleche(1)Australia
SolarEuropeProjects of CN’AIR, ENGIE Green, LANGAFrance90
North AmericaAnson, Bluestone, Gretna, Long DrawUnited States
Asia and OceanieLifou, Kota-bore, Lavaghu, KoumacNouvelle Calédonie
Biomass-biogasEuropeVolV biomassFrance93
DSP Macon(1), DSP Bordeaux 
Biogaz injector 
GeothermalAsia and OceanieMuara Laboh(1)Indonesia13
R&DEurope France46
Global capex in million euros for renewable energy projects693
Energy efficiencyDistrict heating systemEuropeProjects of ENGIE RéseauxFrance4
District cooling systemEuropeProjects of Climespace(1)France6
Energy efficiencyEuropeCertiNergy & SolutionsFrance81
R&DEurope France47
Global capex in millions of euros for energy efficiency projects138
Clean MobilityClean MobilityEuropeChargePointUnited Kingdom165
PowerlinesGermany
GNVvertFrance
EV Box(1)The Netherlands
South AmericaTransantiago(1), Los Andes Rent a CarChili
R&DEurope France4
Global capex in millions of euros for clean mobility projects169
TotalGlobal capex in million euros1000
(1)     Eligible projects having received an allocation in previous Green Bonds


Description of the projects


The main new projects concern the development of solar and wind farms in France and North America. The Group has also acquired Vol-V Biomass thus becoming the leading biomethane production in France with the aim of intensifying the development of this sector in France. The main project allocated in terms of energy efficiency is the acquisition of CertiNergy which reinforces the Group's position on energy saving certificates to accelerate the energy transition of companies and communities. In terms of mobility, the green bond of January 2019 has enabled ENGIE to finance various projects presented in the following link (Clean Mobility) and in particular the acquisition of Powerlines, which enables it to become a major player in the electrification of rail networks in Europe


Impact Reporting 


In the full operation phase, the projects are expected to contribute to avoid emissions of at least 3.43 million tons of CO2eq per year: (i) for renewable projects, a minimum of 3.02 million tons of CO2eq/year, (ii) for mobility projects, 0.04 million tons of CO2eq/year, and (iii) for energy efficiency projects, a minimum of 0.37 million tons of CO2eq/year.


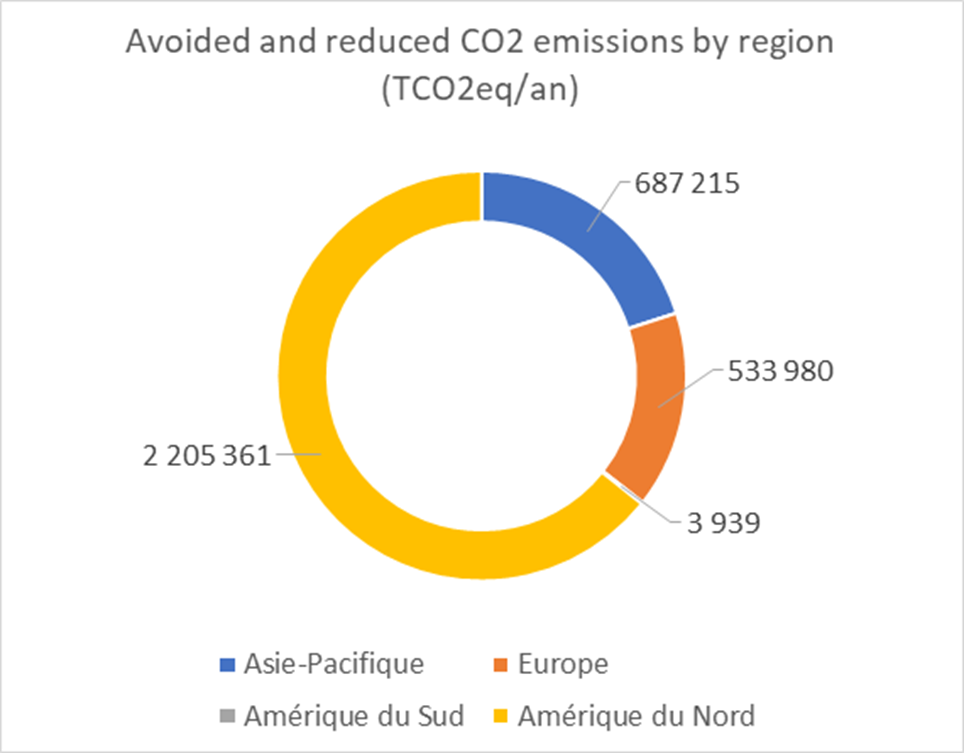
The breakdowns by technology and by region of the impacts in tons of CO2 eq per year of the projects financed by the Green Bond of January 2019 are presented below (at 100%).

Avoided and reduced CO2 Emissions (TCO2eq/an) by technology
Avoided and reduced CO2 emissions by region (TCO2eq/an)

The contributions to reduced or avoided emissions are presented in the following table using different weighting methods: a) at 100% regardless of the Group’s ownership rate and regardless of the nature of the capex (financial or development), b) according to the Group's ownership rate and regardless of the nature of the capex (financial or development), c) considering only the development capex regardless of the Group’s ownership rate (at 100%), and finally d) according to the Group's ownership rate and taking only the development capex.


Contribution to avoided and reduced CO2 Emissions (T C02 eq/an)
 a) linked to development and financial CAPEX taken at 100%b) linked to development and financial CAPEX taken at % of ownershipc) linked to development CAPEX taken at 100%d) linked to development CAPEX taken at % ownership
Biomass-biogas19.91719.9177.8877.887
District systems18.70218.69618.70218.696
Energy efficiency350.894350.894  
Geothermal462.485161.870  
Solar317.61982.726317.61982.726
Wind2.223.202664.6602.158.423644.579
Mobility37.67637.67610.52510.525
TOTAL3.430.4951.336.4392.513.156764.412


ENGIE favors the first method because of its major industrial role in the development of these projects, which leads it not to modify its impact reporting in the event of a sale. However, the contribution according to the three alternative methods is presented at the request of certain investors. 

8. Allocation of the Green Bond of January 2018

Paragraph content

The main Eligible Projects which were financed in 2019 by the product of the Green Bond issue of January 2018 are presented in the following table.


Type of projectsTechnologyRegionProject nameCountryCAPEX (in million euros)
RenewableWindEuropeSeagull 1 and 2(1), ICO WindparkBelgium224
WindfloatPortugal
Goya(1), PhoenixSpain
North AmericaEast Forks(1), Jumbo Hill, Seymour HillsUnited States
South AmericaTres Mesas 3 and 4(1)Mexico
CalamaChile
AfricaRhas GharebEgypt
Asia and OceaniaSECI projets, GUVNL India
SolarEuropeSenecaSpain313
North AmericaFund IVUnited States
South AmericaTrompezon(1), Villa Ahumada(1), Abril(1), Calpulalpan(1), Akin(1), Sol de InsurgentesMexico
Capricornio, TamayaChile
AfricaKathu(1)South Africa
Fenix(1)Ouganda
PowerCorner, MobisolTanzania
Scaling solarSenegal
Asia and OceaniaNadecSaudi Arabia
RetopChina
KadapaIndia
Biomass-biogasEuropeBiogas PlusThe Nederlands59
Sisslerfeld(1)Switzerland
Biogaz injector, ENGIE New VenturesFrance
TransmissionSouth AmericaGralha AzulBrazil10
Global capex in millions of euros for renewable energy projects606
Energy efficiencyEnergy efficiencyEuropeSmart Grid (GAZPAR) (1), ENGIE New VenturesFrance267
South AmericaSalto OsariaBrazil
Energy StorageWorldENGIE EPS(1)Italia3
Global capex in millions of euros for energy efficiency projects270
TotalGlobal capex in million euros876
(1) Eligible projects having received an allocation in previous Green Bond


Supplemented by a part allocated in 2018


Type of projectsTechnologyRegionProject nameCountryCAPEX (in million euros)
RenewableWindNorth AmericaEast ForksUnited States53
EuropeSeamade, Wind4flanders, Wind4WalloniaBelgium
EuropeGoya, ThorSpain Norway
SolarNorth AmericaSocoreUnited States49
South AmericaFloresta (1)Brazil
Global capex in millions of euros for renewable energy projects102
Energy efficiencyEnergy efficiencyNorth AmericaTransantiago(2)Chile22
Global capex in millions of euros for energy efficiency projects22
TotalGlobal capex in million euros124
(1)    Eligible project having received an allocation in previous Green Bond
(2)    Project evaluated under the "energy efficiency" category which will be subsequently evaluated under the clean mobility category according to the evolutions of the framewok


Description of projects

The main new projects concern the development of solar and wind farms on all the continents where the Group is present. In addition to the countries where the Group has a platform for the development of renewables (France, Belgium, USA, Mexico) ENGIE inaugurated in 2019 the largest wind farm in Egypt, has also strengthened its presence in Spain and announced the commissioning of the Kathu thermodynamic solar power plant, one of the largest renewable energy projects in South Africa. Financing also contributed to the financing of the first floating wind farm in continental Europe and the acquisition of Mobisol which enables Engie to become the leader in the off-grid solar market. 


Impact reporting

When fully operational, renewable projects should contribute to avoid emitting greenhouse gases of at least 3.30 million tons of CO2eq / year, while energy efficiency projects should contribute to reduce greenhouse gas emissions of at least 0.09 million tons of CO2eq / year, or a total of 3.39 million tons of CO2eq per year.


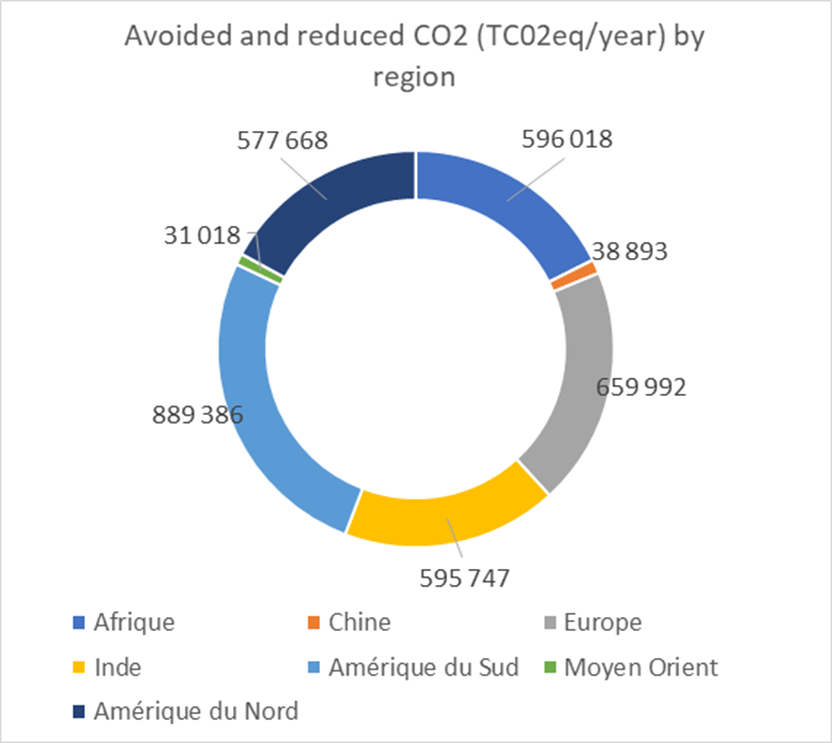
The breakdowns by technology and by region of impacts in tons of CO2 eq / year of the projects funded by the Green Bond of January 2018 are presented below.

Avoided and reduced CO2 emissions (TCO2eq/year) by technology
Avoided and reduced CO2 (TC02eq/year) by region

The contributions to reduced or avoided emissions are presented in the following table using different weighting methods: a) at 100% regardless of the Group’s ownership rate and regardless of the nature of the capex (financial or development), b) according to the Group's ownership rate and regardless of the nature of the capex (financial or development), c) considering only the development capex regardless of the Group’s ownership rate (at 100%), and finally d) according to the Group's ownership rate and taking only the development capex.


Contribution to avoided and reduced CO2 emissions (T C02 eq/year)
 a) linked to development and financial CAPEX taken at 100%b) linked to development and financial CAPEX taken at % of ownershipc) linked to development CAPEX taken at 100%d) linked to development CAPEX taken at % ownership
Biomass-biogas86.54782.60248.35744.413
Energy efficiency85.34280.43485.34280.434
Solar1.302.314720.988907.478529.298
Wind1.913.8681.913.8681.104.714443.983
Mobility650650650650
TOTAL3.388.7222.798.5422.146.5411.098.778


ENGIE favors the first method because of its major industrial role in the development of these projects, which leads it not to modify its impact reporting in the event of a sale. However, the contribution according to the three alternative methods is presented at the request of certain investors.

9. Allocation of the Green Bond of September 2017

Paragraph content

The total funds allocated to Eligible Projects in 2018 amount to 170 million euros for the year 2017 and 1204 million euros for the year 2018 respectively. These amounts have made it possible to allocate 1250 million euros, i.e. the totality of the Green Bond issued in September 2017. The latter contributed to the financing or acquisition of Eligible Projects in the fields of renewable energy and energy efficiency.


The main projects are presented in the table below, which shows the country in which each project is located, the associated technology and the capex allocated for each project.


Type of projectsTechnologyRegionProject nameCountryCAPEX (in million euros)
Renewable WindEuropeProjets de ENGIE Green on shore, CN’Air, ENGIE Green offshore (1)France480
SeamadeBelgium
LANGAFrance
North AmericaInfinityUSA
Live Oak, Solomon ForksUSA
South AmericaTres Mesas 3 et 4Mexico
Asia PacificSainshand, Willogoleche (1)Mongolia, Australia
SolarEuropeProjets de ENGIE Green, Solaire Direct, CN’AirFrance387
LANGAFrance
South AmericaIntipampa, Villa Ahumada, Abril, Calpulalpan, Trompezon, AkinMexico, Peru
AfricaKathuSouth Africa
FenixOuganda
South AmericaParacatu (1)Brazil
BiomassEuropeGNVert, DSP Macon (1)France51
Sisslerfeld (1)Switzerland
TransportSouth AmericaTENChile48
GeothermalAsia PacificMuara LabohIndonesia12
Global capex in millions of euros for renewable energy projects978
Energy efficiencyClean Mobility (2)EuropeEV-BOXPays-Bas85
Energy StorageWorldElectro Power System (EPS)World57
District systemsEuropeClimespace (1)France4
Energy efficiencyEuropeKeepmoat (1)UK126
Projets d’efficacité - C13France
Smart Grid (GAZPAR) (1)France
Global capex in millions of euros for energy efficiency projects272
TotalGlobal capex in millions euros1250
(1) Eligible projects that received an allocation in the Green Bond of March 2017
(2) Projects evaluated on the basis of energy efficiency criteria but which will subsequently be integrated and evaluated according to the "Clean Mobility" category projects integrated into the Group's Green Bond Framework in January 2019.


Description of projects

Description of projects:


Solar and wind energy in US

ENGIE considerably expanded its wind development portfolio in the U.S by acquiring Infinity Renewables, a leading developer of utility-scale wind projects in the United States. The acquisition includes more than 8,000 MW of projects in various stages of development. In end of 2018 ENGIE announced the start of construction of the 276 MW Solomon Forks Wind Project and the 196 MW East Fork Wind Project in northwest Kansas.


Solar and wind energy projects in Europe

ENGIE confirmed in 2018 its number one position in the solar and wind energy sectors in France with the acquisition of the LANGA group. Founded in 2008, the LANGA group, based in Brittany, is one of the most active independent producers of renewable energy, simultaneously present in solar, wind, biogas and biomass. The group is developing 1.3 GW of projects due to be completed by 2022. 


Solar and wind energy projects in Africa

ENGIE announced on 30 January 2019 the commercial operation of the 100 MW Kathu Solar Park in South Africa. This state of the art plant is a greenfield Concentrated Solar Power (CSP) project with parabolic trough technology and equipped with a molten salt storage system that allows for 4.5 hours of thermal energy storage to provide reliable electricity in the absence of solar radiation and during peak demand. Kathu is the first CSP development for ENGIE.


Transmission project in Latin America

Transmisora Eléctrica del Norte (TEN), a subsidiary of ENGIE (50%) and Red Eléctrica Internacional (50%) put into service the first electricity interconnection between Mejillones (Antofagasta Region) and Cardones (Atacama Region) of 500 kilovolts of voltage and 600 kilometers in length. The interconnection between the SING (Norte Grande Interconnected System) and the SIC (Central Interconnected System) networks will create a single, more robust, competitive system which will facilitate the entry of renewable projects. 


Energy efficiency

ENGIE aimed at being at the forefront of the energy transition with the acquisition in 2018 a majority stake of Electro Power Systems (EPS), a pioneer in hybrid solution storages. EPS is a company specialised in energy storage solutions and microgrids that enable intermittent renewable sources to be transformed into a stable power source. With the transaction, both companies aim at further accelerating their vision to be at the forefront of the energy transition, with special focus on decentralised energy solutions.


Clean transportation

ENGIE acquired EV-Box a leading electric charging player. Thanks to this combination, ENGIE intends to be a major global player in this space facilitating the development of clean mobility for its customers, while providing the essential energy solutions to manage the energy needs of electric vehicle charging for customer sites and the electricity network.


Impact Reporting

In the full operating phase, renewable projects (at 100%) should contribute to avoid greenhouse gas emissions of at least 3.01 million tons of CO2eq/year while energy efficiency projects (at 100%) should contribute to reduce greenhouse gas emissions of at least 0.15 million tons of CO2eq/year, that is, a total of 3.16 million tons of CO2eq per year.


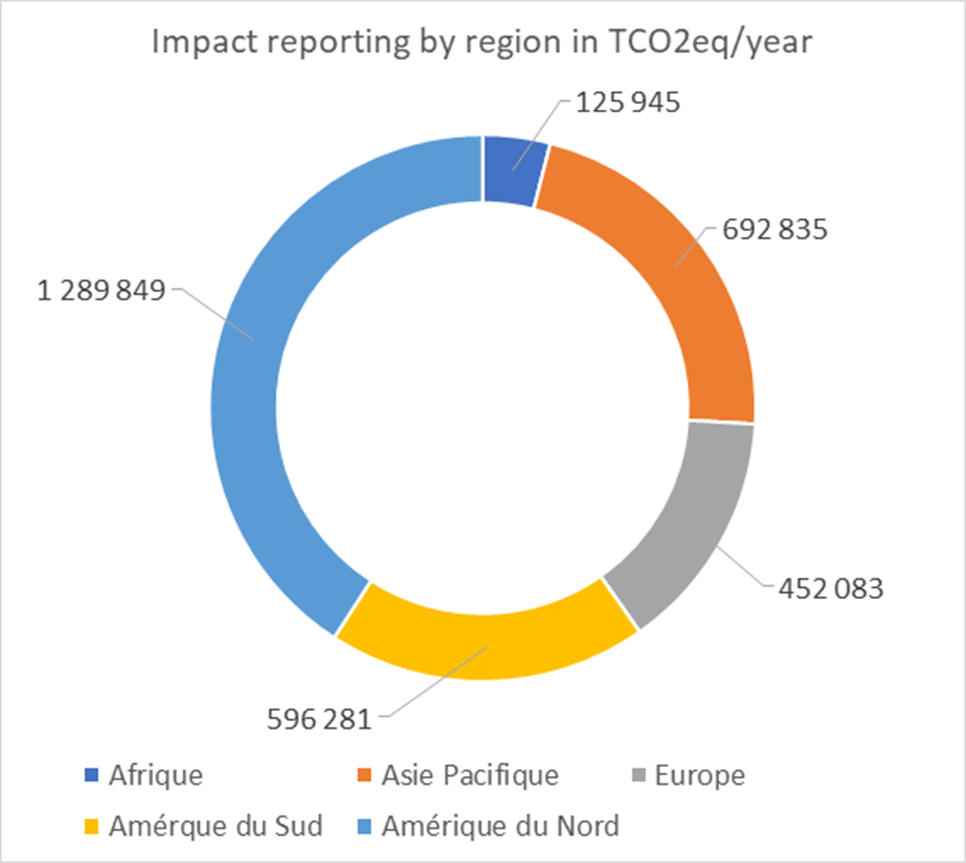
Technology and regional breakdowns of the impacts in tons of CO2 eq of the projects financed by the Green Bond of September 2017 are set out below (at 100%).

 Impact reporting by technology in TCO2eq/year
Impact reporting by region in TCO2eq/year

The contributions to reduced or avoided emissions are presented in the following table using different weighting methods: a) at 100% regardless of the Group’s ownership rate and regardless of the nature of the capex (financial or development), b) according to the Group's ownership rate and regardless of the nature of the capex (financial or development), c) considering only the development capex regardless of the Group’s ownership rate (at 100%), and finally d) according to the Group's ownership rate and taking only the development capex.


Contribution to avoided and reduced CO2Emissions (T C02 eq/year)
 a) linked to development and financial CAPEX taken at 100%b) linked to development and financial CAPEX taken at % of ownershipc) linked to development CAPEX taken at 100%d) linked to development CAPEX taken at % ownership
Wind2.057.7011.758.8871.009.013939.869
Solar528.506455.911399.068391.228
Geothermal398.396139.439  
Energy efficiency136.851136.85138.45938.459
Biomass21.56819.35321.56819.353
Energy storage8.5895.144  
Clean mobility697697  
Disctrict cooling236217236217
Transmission4.4491.174  
TOTAL3.156.9932.517.6721.468.3431.389.126


ENGIE favors the first method because of its major industrial role in the development of these projects, which leads it not to modify its impact reporting in the event of a sale. However, the contribution according to the three alternative methods is presented at the request of certain investors.

10. Allocation du Green Bond de Mars 2017

Paragraph content

The total funds allocated under this issue to Eligible Projects developed during the years 2016 and 2017 amount to 81 million euros and 1419 million euros respectively. These amounts make it possible to allocate €1,500 million, i.e. the totality of the Green Bond issued in March 2017. The March 2017 Green Bond contributed to the financing or acquisition of Eligible Projects in the fields of renewable energy and energy efficiency.


Project typeTechnologyRegionProject nameCountryCAPEX (in million euros)
RenewableWindEuropeProjets de CN’AIR, ENGIE Green, LCV)France293
MorayUK
South AmericaCampo LargoBrazil
North AmericaTrès MesasMexico
OceaniaWillogolecheAustralie
SolarEuropeSolaire Direct, Projets de ENGIE Green, CN’AIR, LCVFrance72
South AmericaParacatu, Floresta (1)Brazil
BiomassEuropeMaconFrance47
SissleerfeldSwitzerland
Global capex in million euros for renewable energy projects412
Energy EfficiencyDistrict coolingAsiaTabreedEmirats Arabes Unis657
Energy EfficiencyNorth AmericaGreen ChargeUSA51
Ohio State universityUSA126
EuropeKeepmoatUK146
Smart Grid (GAZPAR)France78
South AmericaSalto SantiagoBrazil9
Divers 21
Global capex in million euros for energy efficiency projects1088
TotalGlobal capex in million euros1500


Description of projects 

Solar and wind projects in France

ENGIE, a major player in renewable energy production in France, is committed to the energy transition and the development of renewable projects The allocated capex related to the wind and solar projects of its solely owned subsidiary ENGIE Green, resulting from the merger of Futures Énergies and Maia Eolis in 2016 and LCV - La Compagnie du Vent - in 2017 and its subsidiary CNR (Compagnie Nationale du Rhône - 49.9%) through its subsidiary CN'Air (hydroelectricity, onshore wind and solar photovoltaic) for a total installed capacity of 142 MW and 36 MW respectively for wind and solar power. Also worth noting are the two offshore wind projects in Dieppe/Le Tréport, and l’Ile d’Yeu/Noirmoutier (2 x 500 MW in capacity, projects 47% owned by ENGIE). The 2016 financial capex relating to the buyout of minority interests in Solaire Direct has also been included.


Wind (Campo Largo) and solar (Floresta and Paracatu) projects in Brazil

ENGIE, which is the main private electricity producer in Brazil (about 6% of the country's installed capacity) is continuing its development through new renewable energy production projects. Thus renewable energy represents 90% of its installed capacity in Brazil. Capex projects currently under construction and financed by the Green Bond are the Campo Largo onshore wind farm (327 MW), and the Floresta (86 MW) and Paracatu (132 MW) solar farms.


Offshore project (UK)

In September 2011, the Group won a contract with the Portuguese company EDP Renováveis to develop a 950 MW offshore wind farm in the United Kingdom. ENGIE stake: 23%.


Onshore wind project in Australia

ENGIE began pre-construction work in 2017 on the 119 MW Willogoleche wind farm near Hallett in the Mid North region of South Australia. ENGIE's interest in this project is 72%.


Biomass Project

Two cogeneration projects to supply heating networks and operating in biomass co-combustion were integrated into the Green Bond of March 2017 (Mâcon in France - 100% ENGIE, and Sisslerfeld in Switzerland - 60% ENGIE) for an injected biomass estimated at 230 GWh.


Tabreed (United Arab Emirates)

In July 2017, ENGIE bought a 40 percent stake in Tabreed (National Central Cooling Company PJSC), which provides innovative cooling solutions for buildings and other infrastructure to the United Arab Emirates and the member countries of the Gulf Cooperation Council (GCC). The company delivers the equivalent of over 1 million tons of cooling to its clients across 71 district cooling plants located throughout the region, replacing individual refrigeration systems with 40% lower efficiency.


Ohio State University Project (USA)

In April 2017, ENGIE (50%) and Axium Infrastructure US (50%) won a 50-year concession to sustainably manage Ohio State University’s energy infrastructure. The contract pertains to the operation and optimization of the university’s energy production and distribution facilities, and energy efficiency services to reduce energy consumption by 25% within the first ten years of the contract.


Keepmoat (UK)

In March 2017, ENGIE acquired Keepmoat Regeneration, the UK’s leading provider of regeneration services, improving buildings, places and communities through refurbishment and upgrade. Keepmoat has extensive capabilities in creating zero carbon new homes, retrofitting high-rise residential accommodation and supporting the cost reduction and energy efficiency targets of community regeneration projects, such as insulation and heating solutions to on-site generation and energy consultation services. Energy savings were estimated using statistical data based on installed technology. Most of the savings were generated from heat insulation with an estimated efficiency of 20 percent.


Green Charge Project (USA)

In 2016, ENGIE acquired an 80 percent stake in California-based battery power storage company Green Charge Networks (Green Charge). It uses advanced patented software algorithms and analytics to optimize battery systems at commercial & industrial (C&I) and public sector customer sites in the United States. These systems generate financial and environmental benefits by storing energy from an efficient system (generally combined cycles) and avoiding non-efficient peak systems considered 40% less energy efficient.


Project Smart Grid (Gazpar - France)

Since January 2016, more than 160,000 smart meters have been installed in 24 pioneering municipalities. The general roll-out of these gas meters began in May 2017 and will gradually be extended to all French metropolitan regions, benefiting approximately 11 million customers. The smart gas meter allows customers to monitor their consumption to better control it. A technical and economic study carried out under the supervision of the French Energy Regulation Authority ("CRE") based on the GRDF scope, estimated the total possible gains in terms of energy savings following the installation of these smart meters at 1.5%.


Impact Reporting

For CDM (Clean Development Mechanism) projects registered and approved by the United Nations, the results of the calculations are based on the underlying methodologies


PROJECTSAvoided emissions TCO2/ANRÉFÉRENCE UNFCCC
Campo Largo778 493

CPA 10286-0005 : Campo Largo Wind Complex (Phase 1)

Floresta119 806

CPA 10286-0003 : Floresta Solar Power Complex

Paracatu161 341CPA 10286-0004 : Paracatu Solar Power Complex


Reduced and avoided emissions of the March 2017 green bond

In the full operating phase, renewable projects (at 100%) should contribute to avoid greenhouse gas emissions of at least 2.2 million tons of CO2eq/year while energy efficiency projects (at 100%) should contribute to reduce greenhouse gas emissions of at least 1.1 million tons of CO2eq/year, that is, a total of 3.3 million tons of CO2eq per year.


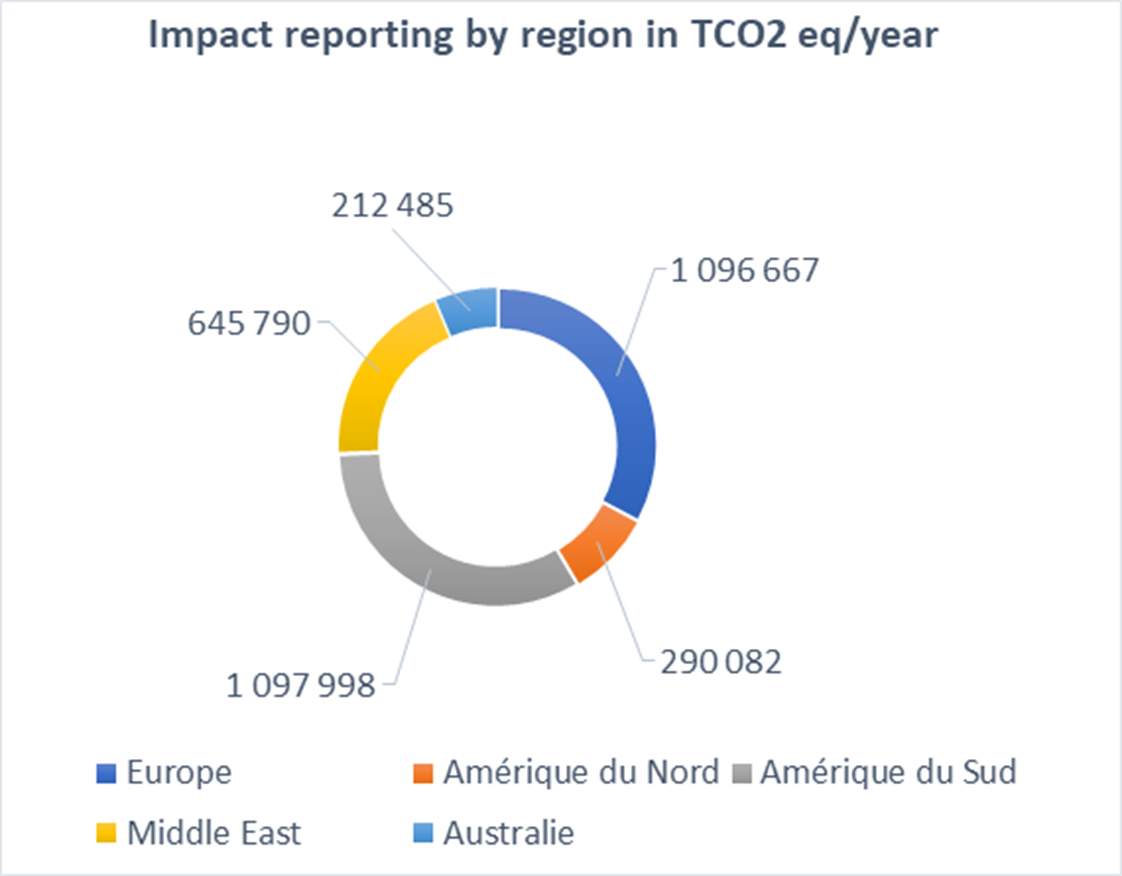
Technology and regional breakdowns of the impacts in tons of CO2 eq /year of the projects financed by the Green Bond of March 2017 are set out below (at 100%).
Impact reporting by technology in TC02 eq/year
Impact reporting by region in TCO2 eq/year

The contributions to reduced or avoided emissions are presented in the following table using different weighting methods: a) at 100% regardless of the Group’s ownership rate and regardless of the nature of the capex (financial or development), b) according to the Group's ownership rate and regardless of the nature of the capex (financial or development), c) considering only the development capex regardless of the Group’s ownership rate (at 100%), and finally d) according to the Group's ownership rate and taking only the development capex.


Contribution to avoided and reduced CO2Emissions (T C02 eq/year)
 a) linked to development and financial CAPEX taken at 100%b) linked to development and financial CAPEX taken at % of ownershipc) linked to development CAPEX taken at 100%d) linked to development CAPEX taken at % ownership
Solar313 001313 001282 099282 099
Wind1 867 418963 7731 058 029752 047
Biomass36 60134 40436 60134 404
District systems675 814285 98530 02427 668
Efficiency450 189322 963182 088170 086
TOTAL3 343 0231 920 1261 588 8411 266 305


ENGIE favors the first method because of its major industrial role in the development of these projects, which leads it not to modify its impact reporting in the event of a sale. However, the contribution according to the three alternative methods is presented at the request of certain investors.