Alternative text
FINANCE

ENGIE financial information as of September 30 - 2019 Sustained growth in Q3 and for 9M 2019 - 2019 full year guidance confirmed

By ENGIE - 07 November 2019 - 07:30

  • Financial results as of September 30, 2019 with earnings acceleration, in line with expectations: current operating income1(COI1) of EUR 3.8bn, up 9%, and 14% on an organic2 basis, and EBITDA of EUR 7.1bn, up 5%, and 7% on an organic2 basis.
  • Sustained Q3 performance, notably with the expected improvement in Nuclear availability as well as good momentum in Renewables.
  • Solid 9M organic2 COI1 growth, up 14% yoy (+ 12% excluding the 2019 positive one-off from Suez linked to the Argentina court case), driven by Nuclear, Thermal, and Others (notably Energy Management), partially offset by Networks.
  • Clients Solutions driven by sustained revenues growth (+10%) and good COI1 performance of decentralized activities.
  • ENGIE confirms its 2019 guidance3 for net recurring income Group share (in a range of EUR 2.5 billion to EUR 2.7 billion) and for the net financial debt / EBITDA ratio (equal to or below 2.5x excluding the TAG acquisition).

 
key financial figures

Presenting the financial information as of September 30, 2019 Isabelle Kocher, ENGIE’s CEO, said: “Our 9M results confirm ENGIE’s ability to grow following the profound transformation undergone over the last three years. This quarter, our increased wind and solar capacity and the Microsoft PPA demonstrate the accelerated development of our Renewables portfolio. The acquisition of Conti in the United States and the launch of ENGIE Impact are two other milestones in the Group’s drive to boost the zero-carbon transition of our clients. ENGIE’s underlying organic performance in Thermal is also solid, across several regions and across both contracted and merchant operations, while we continue to optimize our Networks businesses and integrate the exciting acquisition of TAG in Brazil. Lastly, we confirm our guidance for 2019.”


  • Nuclear was driven by higher availability of Belgian production units and achieved price improvement;
  • Networks were impacted by several factors in France that were expected and are mostly temporary, particularly in gas transmission with tariff linearization and in gas storage with customer penalties due to temporary technical issues. Networks also benefited from the first contribution of TAG in Brazil, acquired earlier this year;
  • In Others, Energy management results were strong, mainly driven by gas contract renegotiations and international activities;
  • Supply activities continued to be impacted by a difficult market context, mainly from margin contractions in French retail;
  • Client Solutions results benefited from an increased level of activity, notably driven by the performance of decentralized activities. SUEZ one-offs additionally contributed positively;   
  • Thermal benefited from liquidated damages (LDs) and positive Power Purchase Agreement (PPA) effects in Latin America, as well as from positive contribution from gas power plants in Australia. Nevertheless, these activities were affected mainly by the disposal of Glow;
  • Renewables benefited from the steep acceleration in asset commissioning and development of wind & and solar capacities with 1.8 GW installed over the first nine months and now 8.8 GW secured out of the target of 9 GW to be installed by 2021. On hydro power production, lower volumes in France had a significant negative impact year on year.  


Analysis of financial data as of September 30, 2019

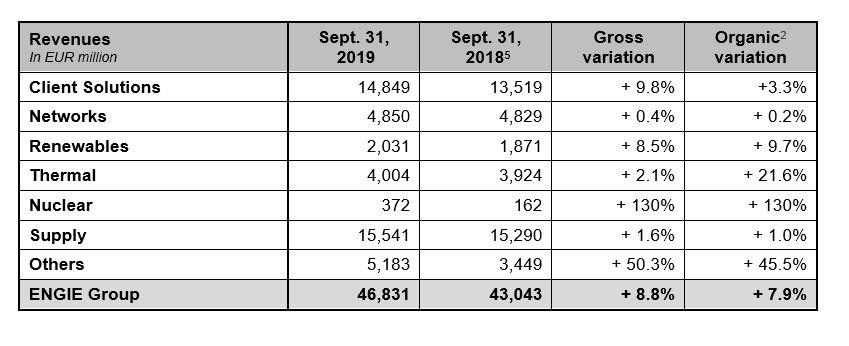
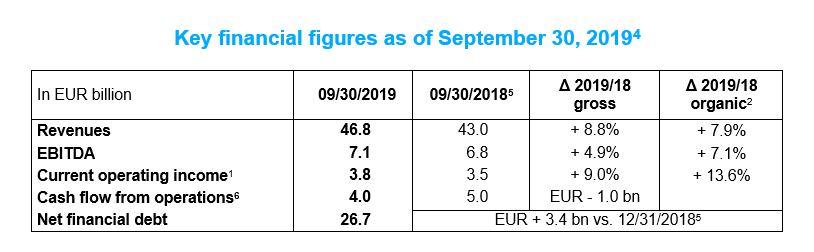
Revenues of EUR 46.8 billion

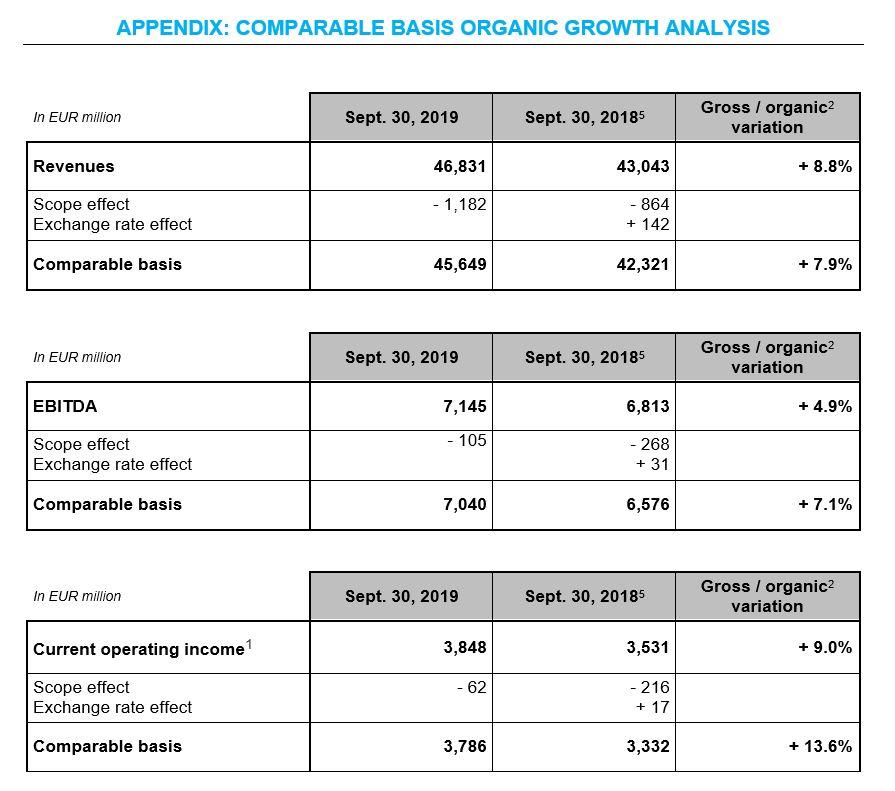
Revenues were EUR 46.8 billion, up 8.8% on a gross basis and 7.9% on an organic2 basis. 

Reported revenue growth includes a slightly positive foreign exchange effect, mainly due to the appreciation of the US dollar, partly offset by the depreciation of the Argentinian peso and the Brazilian real against the euro, and to an aggregate positive scope effect. Changes in the scope of consolidation included various acquisitions in Client Solutions (primarily in the United States, in Latin America and in France) and in business Supply in the US, partly offset by the disposals of the stake of Glow in Thailand in March 2019 and of the business Supply activities in Germany at the end of 2018. 

Organic2 revenue growth was primarily driven by effective energy management services and favorable market conditions for Global Energy Management (GEM) activities, by Thermal in Europe with higher volumes sold, by growth in Client Solutions in France and Europe, by a wide ranging momentum in Latin America (tariff increases in Mexican and Argentinian gas distribution activities, PPA portfolio growth in Chile and dynamic energy allocation as well as commissioning of new wind farms in Brazil), and by Supply activities (benefitting from a favorable market context for business customers in France, higher power sales in France both to business and retail customers and positive price effects in Belgium, Romania and in the United States). This growth was partly offset by lower revenues from gas storage activities with less purchase/sale operations in France and in the United Kingdom.

Clients Solutions revenues were up 10% on a gross basis and 3% on an organic2 basis.


EBITDA of EUR 7.1 billion

EBITDA was EUR 7.1 billion, up 4.9% on a gross basis and 7.1% on an organic2 basis.

These gross and organic2 variations are globally in line with current operating income1 growth, except for the positive one-offs in SUEZ (mainly linked to the settlement of the Argentina court case in 2019) which are not booked at EBITDA level.


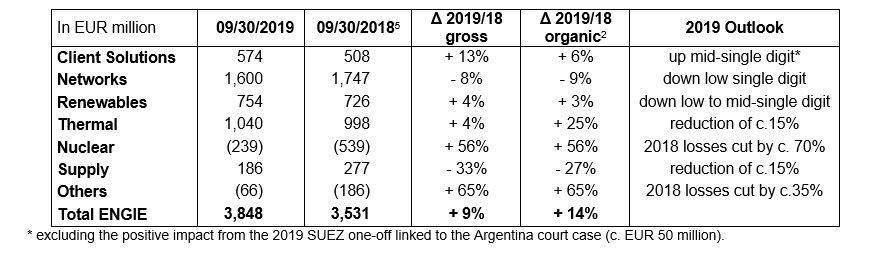
Current operating income1 of EUR 3.8 billion

Current operating income including share of net income of entities accounted for using the equity method (COI) amounted to EUR 3.8 billion, up 9.0% on a reported basis and 13.6% on an organic2 basis.


Reported COI1 increase includes a positive foreign exchange effect, mainly due to the appreciation of the US dollar, partly offset by the depreciation of the Argentinian peso and the Brazilian real against the euro, and to an aggregate negative scope effect. This negative scope effect stems mainly from the sale of Glow, partly offset by various acquisitions predominantly in Networks (TAG), Client Solutions and Renewables.


Based on the reporting segments, the organic2 COI1 growth was mainly driven by Latin America (notably due to the favorable impact of LDs received for Thermal activities in 2019, better performance of hydroelectric power generation and commissioning of new wind and solar assets in Brazil as well as PPA portfolio growth in Chile), by the Rest of Europe (mainly driven by the very strong performance of Nuclear activities with better availability and higher prices, partly offset by decreasing Supply activities in Benelux and Romania), by the Others segment (mainly due to GEM’s good performance in market activities, positive one-offs in SUEZ, higher power margins for business Supply in France; partly offset by some headwinds at Tractebel), and by Middle East, Africa & Asia (mainly driven by higher achieved margins and generated volumes in Thermal generation in Australia; partly offset by a negative temperature effect for Australian Supply).

These positive impacts are partly offset by an organic2 COI1 decrease in France (for France excluding Infrastructures, mainly due to the impact of lower hydroelectric power generation and to margin pressure in Supply activities, partly offset by increasing wind and solar contributions and improved performance on decentralized energy; for France Infrastructures, mainly due to the transmission activity and, to a lesser extent, to the storage profits) and in USA & Canada (mainly driven by Client Solutions, notably due to negative one-offs booked in 2019, by the lower contribution from Thermal activities due to higher costs for LNG sourcing in Puerto Rico, and by the temporary margin pressure on business Supply activities; partly offset by DBSO7 sell down contribution in Renewable activities).  


Organic2 COI1 performance varied also across the Group’s business lines with growth for all business lines except for Networks and Supply:

COI performance
  • Client Solutions reported a 6% organic2 COI1 increase, benefitting from a good commercial performance, an increased contribution of decentralized energy activities and positive one-off from SUEZ linked to the Argentina court case. In addition, restructuring actions are underway in some entities, particularly in Canada.
  • Networks reported a 9% organic2 COI1 decrease. This decrease is mainly due to transmission activities in France from the effects of the merger of the zones (end of subscriptions on North-South transit), mainly caused by the tariff linearization mechanism and higher than expected congestion costs. To a lesser extent, storage profits were impacted by customer penalties due to technical issues in France and negative price effects in Germany. Lastly, a positive one-off was recorded in 2018 in Latin America. Tariff increases in Mexican and Argentinian gas distribution activities only partly offset these negative effects.
  • Renewables reported a 3% organic2 COI1 increase. This was primarily driven by the 1.8 GW commissioning of new wind farms and solar plants since January 1st, 2019, notably in Brazil (0.5 GW) and the US (0.5 GW), and by a better performance of hydroelectric power generation in Brazil. These positive effects were partly offset by the lower hydroelectric power generation in France.
  • Thermal showed a significant 25% organic2 COI1 increase. This increase is mainly attributable to the favorable impact of LDs received in Latin America in 2019, the PPA portfolio growth in Chile and the higher margin achieved and volumes generated in Thermal activities in Australia. These positive effects were partly offset by the suspension of capacity market revenues in the United Kingdom, and the lower contribution in the United States due to higher costs for LNG sourcing in Puerto Rico as well as lower spreads in the US North East in the first half of 2019.
  • Nuclear delivered a very significant 56% organic2 COI1 growth, benefitting from higher availability rates in Belgium following 2018 unplanned outages (+ 2,220bps and + 25% volumes produced) and better achieved prices (+ 2€/MWh).
  • Supply COI1 reduced significantly by 27% on an organic2 basis, primarily driven by margin pressures for retail sales in France on market offers in gas and power, by a negative temperature effect in Australia as well as lower results in business sales in Benelux and in the United States. These effects were partly offset by higher power margins for business supply activities in France.
  • The Others segment delivered a very significant 65% organic2 COI1 growth, mainly reflecting GEM’s good performance on market activities notably with strong positive impact from gas contract renegotiations and significant positive timing effects, as well as lower Corporate costs.


Net financial debt at EUR 26.7 billion

At the end of September 2019, net financial debt stood at EUR 26.7 billion, up EUR 3.4 billion compared with December 31, 20185. This variation was mainly due to (i) capital expenditures over the period (EUR 7.0 billion[i], including notably the EUR 1.5 billion expenditures for the TAG transaction in Brazil), (ii) dividends paid to ENGIE SA shareholders (EUR 1.8 billion) and to non-controlling interests (EUR 0.7 billion) and (iii) other elements (EUR 0.5 billion) mainly related to foreign exchange rates, new right-of-use assets accounted for over the period and mark-to-market variation. These items were partly offset by (i) cash flow from operations7 (EUR 4.0 billion) and (ii) the impacts of the portfolio rotation program (EUR 2.6 billion, mainly related to the completion of the disposal of the stake in Glow). In particular, ENGIE paid a higher than usual dividend in the first three quarters of 2019 (EUR0.75 per share paid in May but no more interim dividend paid in October).


Cash flow from operations7 amounted to EUR 4.0 billion, down EUR 1.0 billion. The decrease stemmed chiefly from temporary working capital requirement variations (EUR 1.6 billion negative impact) caused by margin calls on derivatives and mark-to-market variation of financial derivatives, partly offset by the increase of operating cash flow (EUR 0.4 billion) and lower tax and interests paid (EUR 0.1 billion).


At the end of September 2019, net financial debt to EBITDA ratio amounted to 2.7x. Excluding the TAG acquisition which does not yet materially contribute to the EBITDA, this ratio amounted to 2.5x, slightly increasing compared with the end of 20185 and on the target of less than or equal to 2.5x. The average cost of gross debt was 2.73%, slightly up compared with the end of 2018, notably due to new borrowings in Brazil.


At the end of September 2019, net economic debt9to EBITDA ratio stood at 4.0x. Excluding the TAG acquisition, this ratio stood at 3.8x, slightly increasing compared with the end of 20185.


The Group’s robust financial structure has been reaffirmed by S&P, which confirmed its A- rating in April, and by Fitch, which confirmed its A rating in June, both maintaining their stable outlook. In June, as announced, Moody’s downgraded its rating from A2 to A3 following the adoption of the Loi PACTE in France which has prompted a reappraisal of its one notch uplift for government support.


2019 financial targets3

ENGIE confirms its financial anticipations for 20193:

  • a net recurring income Group share (NRIgs) between EUR 2.5 and EUR 2.7 billion. This guidance is based on an indicative range for the EBITDA of EUR 9.9 to 10.3 billion,
  • a net financial debt / EBITDA ratio below or equal to 2.5x excluding the TAG acquisition,
  • an ‘A’ category credit rating.


Operational milestones: towards a zero-carbon transition

ENGIE continued to pursue its strategy, focused on zero-carbon transition leadership in the first three quarters of 2019.

In Client Solutions, ENGIE and its partners were awarded a 35-year energy efficiency contract in Ottawa to deliver and modernize heating and cooling systems for Government of Canada buildings. In addition, ENGIE acquired Conti, a North American provider of services to the building, design, engineering and construction sectors. Lastly, GE Renewable Energy has chosen ENGIE Impact, our recently launched consulting entity, to help meet its aggressive zero-carbon goal by 2020.

In Networks, ENGIE announced on June 13, 2019 that the consortium in which it holds a majority stake completed the acquisition of a 90% shareholding in TAG, owner of the largest Brazilian gas transmission network. TAG’s portfolio of long-term contracts provides an attractive earnings stream and rebalances ENGIE’s geographic exposure in Networks activities.

In Renewables, 1.8 GW of wind and solar capacity was commissioned in the first three quarters, confirming a marked acceleration after the commissioning of 1.1 GW for the full year 2018, and 8.8 GW are now installed, under construction or secured to reach the 9 GW target of commissioning over 2019-21. The new joint-venture in Mexico with Tokyo Gas and the long-term solar and wind energy PPAs announced with Microsoft and Walmart in the US demonstrate our ability to deploy our DBSO7 model and attract strong partners to accelerate the development of our portfolio both for installed capacities as well as for corporate PPAs. In offshore wind, the signing of a strategic Memorandum of Understanding with EDP aims at creating a leading global player.

In Thermal, ENGIE continued to execute its strategy of carbon footprint reduction. ENGIE closed the disposal of its 69.1% stake in Glow in Thailand (3.2 GW of generation capacity, of which 1.0 GW is coal), ending its participation in coal in Asia-Pacific. ENGIE also announced the disposal of its German and Dutch coal assets (capacity of 2.3 GW), reducing coal to c. 4% of its global power generation capacity after closing of this transaction.

The presentation of the Group’s financial information as of September 30, 2019 used during the investor conference call is available to download from ENGIE’s website:

https://www.engie.com/en/finance/resultats/2019

 
events
APPENDIX

Revenues for France increased by 4.3% on a gross basis and by 2.8% on an organic2 basis.

For France excluding Infrastructures, revenues increased by 5.9% on a gross basis and by 5.0% on an organic2 basis. The higher gross increase than the organic2 decrease is explained by the acquisition of several companies in the Client Solutions activities. The organic2 increase is mainly due to higher sales in Client Solutions activities (installations, construction and energy efficiency) as well as in retail power supply and is partly offset by the lower hydroelectric power generation and by lower gas sales volumes (due to a reduction of the customer base in retail gas supply and a negative temperature effect).

For France Infrastructures, revenues were flat on a gross basis and decreased by 2.7% on an organic2 basis. The organic2 decrease is due to gas storage with a reduction in purchase/sale operations in France as a result of the new regulatory framework implemented in 2018 and lower gas storage revenues in the United Kingdom, partly offset by the distribution activity, which benefitted from tariff increases of July 1, 2018 (+2.0%) and July 1, 2019 (+0.5%). On a gross basis, this organic2 decrease is offset by the outsourcing of LNG activities.


Revenues for Rest of Europe were up 11.5% on a gross basis and 12.6% on an organic2 basis.

Revenue growth was driven mainly by Thermal activities (benefiting from favorable volume and price effects, partially offset by the suspension of the capacity remuneration mechanism in the United Kingdom since October 1, 2018, resulting in the non-recognition of the corresponding revenues), by Client Solutions activities in Belgium (notably on installation and energy efficiency) and in Spain (mainly on installation), by Nuclear recovery both in volumes and price and by Supply activities in Benelux (fueled by positive price effects) and in Romania. On a gross basis, this organic2 increase is partially offset by the sale of the BtoB Supply activities in Germany at the end of 2018 despite contributions of several tuck-in acquisitions in Central Europe (notably OTTO in Germany).


Revenues for Latin America increased by 14.9% on a gross basis and by 11.7% on an organic2 basis.

Gross growth includes the positive impact of the integration of a Client Solutions service company (CAM) acquired at the end of 2018, partially offset by a globally unfavorable exchange rate effect, driven by the depreciation of the Argentinian peso (- 53%) and the Brazilian real (- 2%), only partially compensated by the appreciation of the US dollar (+ 6%), Mexican peso (+ 5%) and Peruvian sol (+ 4%). In Brazil, organic2 growth was mainly due to dynamic hydro energy allocation and to the commercial commissioning of new wind and solar farms. In Chile, the business was positively impacted by the ramp up of long-term PPAs.


Revenues for USA & Canada were up 33.5% on a gross basis and 8.5% on an organic2 basis.

They benefited from a positive exchange rate effect due to the appreciation of the US dollar and positive scope effects due to the contribution of acquisitions in Client Solutions (Donnelly, Unity, Systecon) and in power Supply activities (Plymouth Rock) in the USA. The organic2 growth was mainly due to a positive price effect in the power B2B Supply activities in the USA.


Revenues for Middle East, Africa & Asia were down 22.9% on a gross basis and 3.8% on an organic2 basis.

The higher gross decrease is mainly due to the negative scope effect of the disposal of Glow (Thailand) in March 2019, partly offset by acquisitions in Client Solutions in the Middle East (Cofely BESIX) and Asia as well as by positive currency effects mainly linked to the appreciation of the US dollar. On an organic2 basis, Supply showed a lower performance (mainly in Australia) and Customer Solutions activities delivered lower revenues in Africa and Australia.


Revenues for the Others segment increased by 15.2% on a gross basis and by 11.9% on an organic2 basis.

This increase is mainly due to the GEM activities fueled by growth in international activities and gas contracts renegotiation as well as to Supply activities benefitting from a favorable market context for business customers in France.


Contributive revenues by business line:

contributive revenue-business line
appendix growth analysis

The calculation of organic2 growth aims to present comparable data both in terms of the exchange rates used to convert the financial statements of foreign companies and in terms of contributing entities (consolidation method and contribution in terms of comparable number of months). Organic2 growth in percentage terms represents the ratio between the data for the current year (N) and the previous year (N-1) restated as follows:
 

  • The N-1 data is corrected by removing the contributions of entities transferred during the N-1 period or pro rata temporis for the number of months after the transfer in N.
  • The N-1 data is converted at the exchange rate for the period N.
  • The N data is corrected with the N acquisition data or pro rata temporis for the number of months prior
    to the N-1 acquisition.


1Including share in net income of entities accounted for using the equity method.
2Organic variation = gross variation without scope and foreign exchanges impacts.
3These targets and this indication assume average weather conditions in France, full pass through of supply costs in French regulated gas tariffs, no significant accounting changes except for IFRS 16, no major regulatory and macroeconomic changes, commodity price assumptions based on market conditions as of December 31, 2018 for the non- hedged part of the production, average foreign exchange rates as follows for 2019: EUR/USD: 1.16; EUR/BRL: 4.42, and without significant impacts from disposals not announced as of February 28, 2019.
4Variations vs. 9M 2018.
52018 figures adjusted for IFRS 16.
6Cash flow from operations = Free Cash Flow before maintenance Capex.
7DBSO = Develop, Build, Share & Operate.
8Net of DBSO partial sell-downs.
9Net economic debt amounted to EUR 39.9 billion at the end of September 2019 (compared with EUR 35.7 billion at the end of December 2018); it includes, in particular, nuclear provisions and post-employment benefits.


Important notice


The figures presented here are those customarily used and communicated to the markets by ENGIE. This message includes forward-looking information and statements. Such statements include financial projections and estimates, the assumptions on which they are based, as well as statements about projects, objectives and expectations regarding future operations, profits, or services, or future performance. Although ENGIE management believes that these forward-looking statements are reasonable, investors and ENGIE shareholders should be aware that such forward-looking information and statements are subject to many risks and uncertainties that are generally difficult to predict and beyond the control of ENGIE, and may cause results and developments to differ significantly from those expressed, implied or predicted in the forward-looking statements or information. Such risks include those explained or identified in the public documents filed by ENGIE with the French Financial Markets Authority (AMF), including those listed in the “Risk Factors” section of the ENGIE (ex GDF SUEZ) reference document filed with the AMF on March 20, 2019 (under number D.19-0177). Investors and ENGIE shareholders should note that if some or all these risks are realized they may have a significant unfavorable impact on ENGIE.