FINANCE

ENGIE 2019 financial results

By ENGIE - 27 February 2020 - 08:15

2019 net recurring income Group share guidance achieved EUR 0.80 dividend per share to be proposed at the AGM (+7% vs. 2018)


  • Net recurring income Group share (NRIgs) of EUR 2.7bn, up 9%, and 11% on an organic1 basis.
  • Current operating income (COI) of EUR 5.7bn, up 11%, and 14% on an organic1 basis, mainly driven by Nuclear, Others (notably Energy Management), Thermal and Renewables, partially offset by Supply and Networks. EBITDA of EUR 10.4bn, up 7%, and 8% on an organic1 basis.
  • Financial net debt increased by EUR 2.7 bn mainly due to growth investments, notably the TAG acquisition, which closed in H1. Financial net debt / EBITDA ratio of 2.5x.
  •  For fiscal year 2019, it will be proposed to the AGM to increase the dividend to EUR 0.80 per share, up 7% versus 2018 ordinary dividend.
  • 2020 net recurring income Group share (NRIgs) expected to be between EUR 2.7bn – EUR 2.9bn2. For 2022, ENGIE anticipates a NRIgs CAGR in the range of 6-8% (to reach between EUR3.2 and 3.4 billion). 
Key financial figures as of December 31, 2019

Presenting the 2019 financial results, Judith Hartmann, EVP and Group Chief Financial Officer, said:


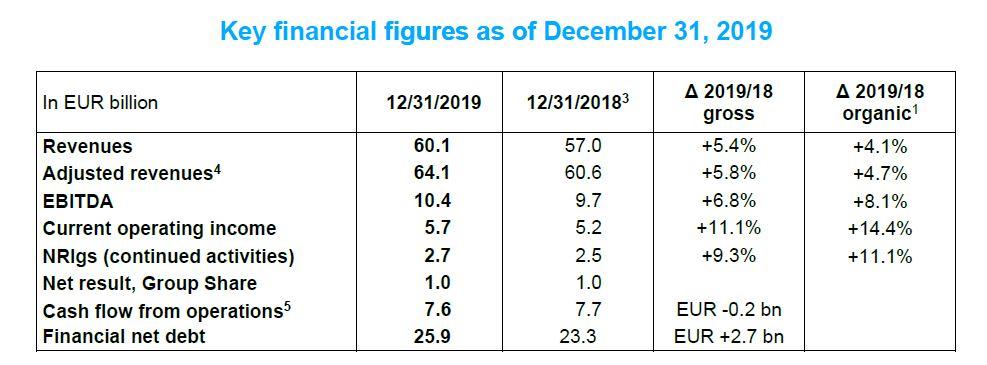
In 2019, the Group reported good financial performance, with revenues of EUR 60.1 billion, an organic increase of 4%, and NRIgs of EUR 2.7bn, up 11% organically. These results were driven by increased nuclear availability and energy management performance. 2019 saw a range of activity enhancing the Group’s growth profile, including commissioning of 3.0 GW of new renewable generation capacity, quadruple our 2018 run-rate and in line with our medium-term target. We strengthened our Latin American presence with the acquisition of a major Brazilian gas transmission network. Recent acquisitions built momentum in Client Solutions. We also continued to decarbonize our power generation portfolio with the completion of coal disposals in Asia and Europe. Alongside this performance, greater medium-term visibility was reached with the updates of the French gas network remuneration scheme and the Belgian nuclear provision and funding arrangements. Going forward, we remain firmly committed to a strong investment grade credit rating, which should enable us to seize attractive investment opportunities while continuing to offer one of the strongest balance sheets in the sector.


Jean-Pierre Clamadieu, Chairman of the Board of Directors of ENGIE, added:


The Board and top management are fully aligned to pursue ENGIE’s transformation path to be a leader in the energy and climate transition. The interim collective management in place - namely Paulo Almirante, Judith Hartmann and Claire Waysand – has the priority to maintain the engagement of the teams and to reach our operational and financial performance. They will set up and implement a roadmap to simplify, clarify and strengthen our business model. They can count on my support to ensure the success of this transition period.


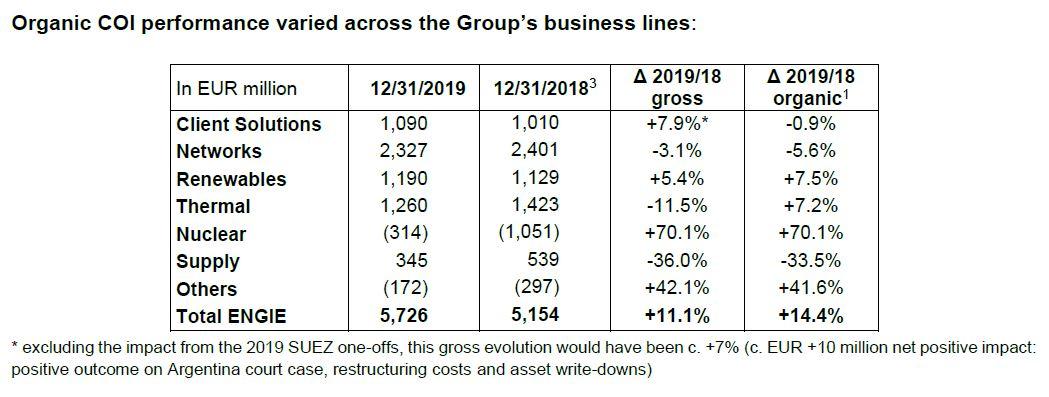
In 2019, the drivers of the gross COI evolution were as follows: 

  • Nuclear was driven by higher availability of Belgian production units and slightly more favorable achieved prices;
  • In business line Others, increasing Energy Management results were mainly driven by the partial sale of a gas supply contract, performance of market activities and gas contract renegotiations; 
  • Client Solutions results benefited from the contribution of acquisitions and the performance of decentralized energy activities, partly offset by investments in business development capability and some operational restructuring actions; 
  • Networks was impacted by several negative effects outside France (mainly one-offs and temperature) as well as several adverse factors in France that were expected and are mostly temporary (mainly tariff smoothing in transmission). Networks also benefited from the first year contribution of the TAG gas transmission pipeline in Brazil, acquired in mid-2019;
  • Renewables benefited from higher Brazilian hydro prices and increasing commissioning of renewable capacity (3.0 GW in 2019). The target of 9 GW to be commissioned from 2019 to 2021 is now fully secured; 
  • Supply activities continued to be impacted by a difficult market context, mainly from margin contractions in French retail, by positive 2018 one-offs in Benelux and adverse temperature effects in Australia and France;
  • Thermal was impacted by the disposal of Glow partly offset by Power Purchase Agreement (PPA) performance and positive market price conditions in Chile as well as the reinstatement of the capacity remuneration mechanism in the UK.


ENGIE continued to pursue its strategic focus on the energy transition in 2019.


In Client Solutions, ENGIE and its partners won commercial contracts for the University of Iowa (United States), government buildings in Ottawa (Canada), a “smart region” around Angers (France) and industrial buildings in Singapore. In addition, ENGIE made several acquisitions including Conti in North America, Otto Industries in Germany and Powerlines in Austria. ENGIE Impact was created to bring large customers with solutions to build their sustainability roadmap and accelerate their energy transition.


In Networks, ENGIE announced on June 13, 2019 that the consortium in which it holds a majority stake completed the acquisition of a 90% shareholding in TAG, the largest gas transmission network owner in Brazil. TAG has a portfolio of long-term contracts providing an attractive earnings stream and improves diversification of ENGIE’s geographic footprint in Networks activities. In January 2020, ENGIE also further strengthened its position in Brazil by announcing the acquisition of a project of a 1,800 km power transmission line. Finally, ENGIE gained visibility on the financial outlook of its French gas networks activities with the conclusion of the regulatory reviews between the end of 2019 and the beginning of 2020.


In Renewables, 3.0 GW of renewable capacity was commissioned and the 9 GW commissioning target over 2019-21 is now fully secured. The new joint-venture in Mexico with Tokyo Gas and the strategic partnership signed with Edelweiss Infrastructures Yield in India at the beginning of 2020 demonstrate ENGIE’s ability to deploy the DBSO6 model and attract partners for the development of its portfolio. In addition, ENGIE, along with financial partners, won a bid to acquire a 1.7 GW hydroelectric portfolio from EDP in Portugal. Finally, in January 2020, ENGIE reached an agreement with EDPR for the 50/50 joint-venture in offshore wind to create a global offshore wind player.


In Thermal, ENGIE continued to execute its carbon footprint reduction strategy, with coal now approximately 4% of global power generation capacity, following the disposal of its 69.1% stake in Glow in Thailand and Laos (3.2 GW of generation capacity, of which 1.0 GW is coal), ending its participation in coal in the Asia-Pacific region, and the disposal of its German and Dutch coal assets (capacity of 2.3 GW). 


In Nuclear, an arrangement on Belgian nuclear provisions was reached reducing uncertainty for all parties regarding the level of provisions and their funding.


New set of Corporate Social Responsibility objectives

Convinced that Corporate Social Responsibility is one of the success criteria for its future, ENGIE has adopted a new set of objectives to be met by 2030 (list of 19 objectives), aligned to the United Nations Sustainable Development Goals. 


Among these objectives, 3 key objectives will be integrated in a recurring reporting given the large role they play in moving ENGIE forward:

  • • Greenhouse Gases emission from production of electricity should be reduced from 149 Mt in 2016 to 43
    Mt in 2030 (for 80 Mt in 2019). ENGIE obtained the 2° certification by the SBTi (Science Based Targets
    initiative) of its Greenhouse Gases emission trajectory, recognized as compatible with the Paris
    Agreement;
  • on gender diversity, the share of women in the management of the Group should increase from c. 23% in
    2016 to 50% in 2030 (for 24% in 2019), through internal promotions and external recruitment;
  • the share of renewable energy in the power production capacity mix should reach 58% in 2030, compared
    to 20% in 2016 (for 28% in 2019).


Analysis of financial results as of December 31, 2019 

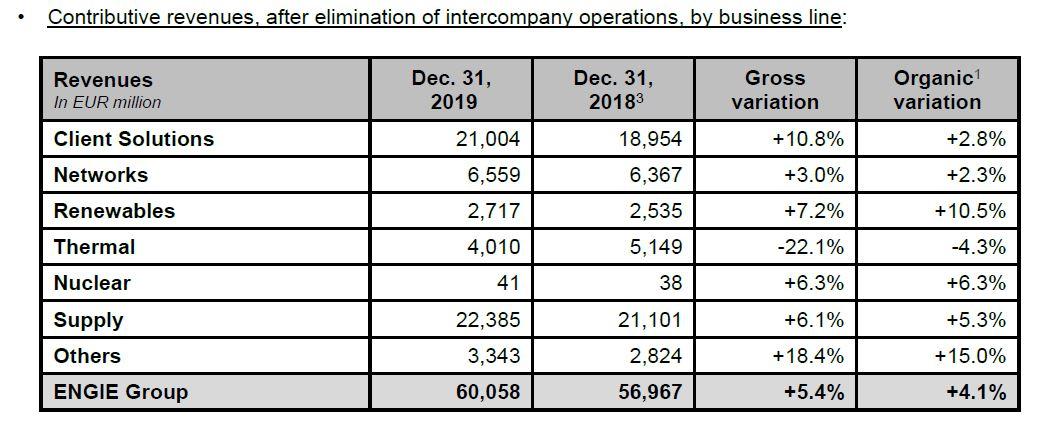
Revenues of EUR 60.1 billion


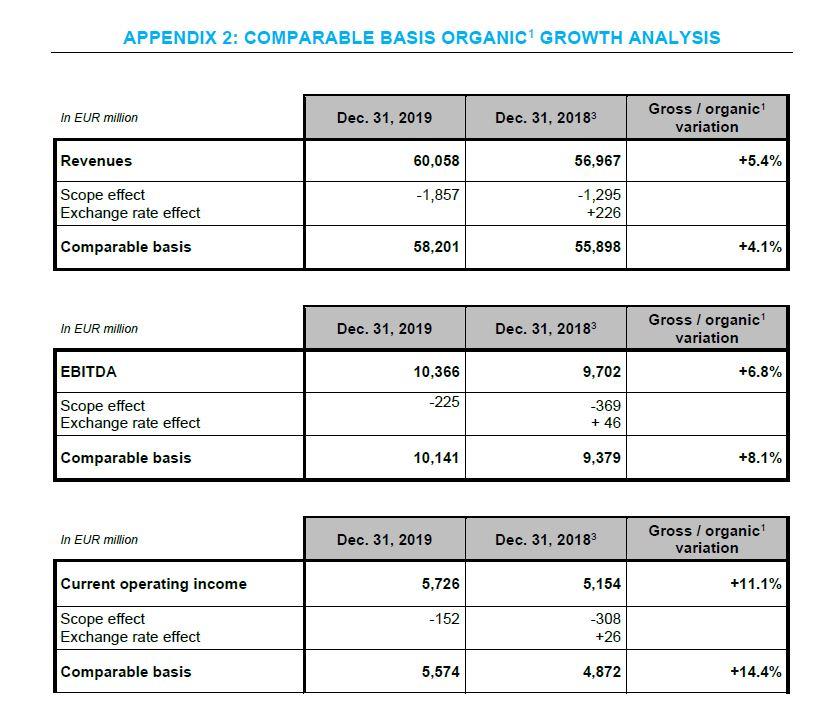
Revenues were EUR 60.1 billion, up 5.4% on a gross basis and 4.1% on an organic1 basis. 


Reported revenue growth was driven by scope effects, including various acquisitions in Client Solutions (primarily in the United States with Conti, France and Latin America with CAM) and in BtoB Supply in the US, partially offset by the disposals of ENGIE’s stake in Glow in Thailand in March 2019 and of BtoB Supply activities in Germany at the end of 2018. This growth also includes a slightly positive foreign exchange effect, mainly due to the appreciation of the US dollar, partly offset by the depreciation of the Argentinian peso and the Brazilian real against the euro.


Organic1 revenue growth was primarily driven by Supply revenues in North America, France and Europe, growth in Client Solutions in Europe, energy management services and favorable market conditions for Global Energy Management (GEM) activities and strong momentum in Latin America (PPA portfolio growth in Chile as well as commissioning of new wind and solar farms in Brazil). This growth was partially offset by lower revenues from Supply activities in the UK and Australia and from Thermal activities in Europe.
Clients Solutions revenues were up 11% on a gross basis and 3% on an organic1 basis, benefiting from a positive effect of acquisitions and favorable market context for industrial clients in Europe.


EBITDA of EUR 10.4 billion

EBITDA was EUR 10.4 billion, up 6.8% on a gross basis and 8.1% on an organic1 basis. 
These gross and organic1 variations are overall in line with the current operating income growth, except for the increase in depreciation mainly due to the commissioning of assets in Latin America and in France, especially in Networks which are not taken into account at EBITDA level.
In addition, Lean 2021, which contributes to the organic increase at EBITDA and COI levels, exceeded the 2019 targets and is on track to meet the target set for 2021.


Current operating income of EUR 5.7 billion

Current operating income amounted to EUR 5.7 billion, up 11.1% on a reported basis and 14.4% on an organic1 basis.


The reported COI growth includes a positive foreign exchange effect, mainly due to the appreciation of the US dollar, partly offset by the depreciation of the Argentinian peso and the Brazilian real against the euro. This positive effect is partly offset by an aggregate negative scope effect, including the disposal of the 69.1% stake in Glow in Thailand and Laos, partly offset by various acquisitions predominantly in Networks (TAG) and in Client Solutions.
 

Organic COI performance
  • Client Solutions reported a 1% organic1 COI decrease, impacted by headwinds in specific segments and an increase in development costs notably on newer growth businesses. These effects were partly offset by an increased contribution from SUEZ and decentralized energy activities. 
  • Networks reported a 6% organic1 COI decrease, mainly due to gas distribution activities with 2018-19 negative one-off effects recorded outside of France and negative temperature effects in France and in Europe, only partially offset by a commissioning costs provision reversal and tariff increases in France. Gas transmission activities in France also suffered from a negative volume effect due to the merger of the North and South gas market zones and from a negative price effect resulting from tariff smoothing.
  • Renewables reported an 8% organic1 COI increase, primarily driven by higher prices for hydroelectric power generation in Brazil and in France and the 3.0 GW commissioning of new capacities since January 1st, 2019, notably in Brazil (0.5 GW), the US (0.5 GW), Spain (0.4 GW), Mexico (0.3 GW), India (0.3 GW), France (0.3 GW) and Egypt (0.3 GW). These positive effects were partly offset by lower DBSO6 margins compared to the high level of DBSO6 transactions in 2018 and lower hydroelectric power generation in France.
  • Thermal showed a 7% organic1 COI increase, mainly attributable to the PPA portfolio growth and positive market price conditions in Chile. In addition, the reinstatement of the capacity remuneration mechanism in the UK , as well as and the favorable impact of the gas spreads in Europe were positive. These effects were partially offset by the expiry of a PPA in Turkey in April 2019. The amount of liquidated damages received was roughly stable in 2019 versus 2018.
  • Nuclear delivered a 70% organic1 COI growth, benefiting from higher availability rates in Belgium following 2018 unplanned outages (+2,720bps and +62% volumes produced) and better achieved prices (+2€/MWh). 
  • Supply COI reduced by 34% on an organic1 basis, primarily driven by margin pressures on French gas and electricity retail contracts, a commissioning costs accrual reversal (related to the coverage of the cost to serve customers handled by energy suppliers during the French market opening, from 2007 to 2016, fully offset by a symmetrical provision reversal for Gas distribution in France), 2018 positive one-offs in Benelux and negative temperature effects in Australia and in France. These effects were partly offset by higher business margins in France.
  • Others business line delivered 42% organic1 COI growth, mainly reflecting GEM’s good performance coming from the partial sale of a gas supply contract to Shell, a positive impact from gas contract renegotiations and overall favorable market conditions, as well as lower Corporate costs.
organic COI growth

Based on the reportable segments, the organic1 COI growth was led by the Rest of Europe (mainly driven by the recovery of Nuclear activities with better availability and higher prices, the reinstatement of the capacity remuneration mechanism in the UK, the favorable impact of gas spreads in Europe; partly offset by 2018 positive one-offs including Liquidated Damages received, difficulties in Benelux and the UK in Supply activities and in Client Solutions with some loss-making contracts), by the Others segment (mainly due to GEM’s good performance in market activities and an increased contribution from SUEZ) and by Latin America (notably due to the favorable impact of LDs received in Thermal activities in 2019, higher prices for hydroelectric power generation and commissioning of new wind and solar assets in Brazil and in Mexico as well as PPA portfolio growth in Chile).
These positive impacts were partly offset by an organic1 COI decrease in Middle East, Africa & Asia (mainly driven by headwinds in Supply in Australia and Africa, in Networks in Turkey, partly offset by positive contribution of Thermal generation and Renewables activities), in France (for France excluding Infrastructures, mainly due to lower DBSO6 margins compared to the 2018 high level, margin pressure in Supply activities and lower hydroelectric power generation partly offset by higher hydro prices, increased wind and solar contributions and improved profitability in Client Solutions activities; for France Infrastructures, mainly due to the lower contribution of transmission and distribution activities) and in USA & Canada (mainly driven by Client Solutions, notably due to negative one-offs booked in 2019, lower contribution from Thermal activities due to lower capacity prices; partly offset by higher DBSO6 margins and commissioned asset contributions in Renewable activities).


Net recurring income, Group share on continued activities of EUR 2.7 billion
Net income, Group share of EUR 1.0 billion

Net recurring income, Group share relating to continued operations amounted to EUR 2.7 billion compared with EUR 2.5 billion in 2018. This increase was mainly driven by the continued improvement in the current operating income partly offset by higher taxes, mainly due to the 2018 positive effect from the recognition of deferred tax assets and slightly higher recurring financial costs, reflecting the modification in the business mix (higher debt in Brazil).


Net income Group share amounted to EUR 1.0 billion in 2019, stable year-on-year, as a result of the increase in Net recurring income and gains on disposals, mainly resulting from the Glow transaction, which offset the impact of the triennial review of nuclear provisions in Belgium and minor negative mark-to-market variation.


Financial net debt at EUR 25.9 billion

Financial net debt stood at EUR 25.9 billion, up EUR 2.7 billion compared to December 31, 20183. This variation is attributed to (i) capital expenditures over the period (EUR 10.0 billion7, including the EUR 1.5 billion expenditures for the TAG transaction in Brazil), (ii) dividends paid to ENGIE SA shareholders (EUR 1.8 billion) and to non-controlling interests (EUR 0.7 billion) and (iii) other elements (EUR 0.6 billion) mainly related to foreign exchange rates, new right-of-use assets and mark-to-market variations. These items were partly offset by (i) cash flow from operations5 (EUR 7.6 billion) and (ii) the impacts of the portfolio rotation program (EUR 2.8 billion, mainly related to the Glow disposal).


Cash flow from operations5 amounted to EUR 7.6 billion, down EUR 0.2 billion. The decrease stemmed predominantly from working capital requirement variations (EUR 1.3 billion negative impact), mainly caused by margin calls on derivatives and mark-to-market variation of financial derivatives, partly offset by the increase of operating cash flow (EUR 0.9 billion) and lower tax and interests payments (EUR 0.2 billion).


At the end of December 2019, the financial net debt to EBITDA ratio amounted to 2.5x. Excluding the TAG acquisition which was not included in the 2019 guidance and which contributed only partially to the 2019 EBITDA, this ratio amounted to 2.4x, stable compared to the end of 20183 and on the target of less than or equal to 2.5x. The average cost of gross debt was 2.70%, slightly up compared to the end of 2018, notably due to new borrowings in Brazil.


At the end of December 2019, the economic net debt8  to EBITDA ratio stood at 4.0x. Excluding the TAG acquisition, this ratio stood at 3.8x, slightly increasing compared to December 2018.


2020 & 2022 financial targets2

ENGIE anticipates 2020 net recurring income, Group share to be between EUR 2.7 and EUR 2.9 billion.
This guidance is based on an indicative EBITDA range of EUR 10.5 to EUR 10.9 billion and COI range of EUR 5.8 to EUR 6.2 billion.

COI Indicative expectations by Business Line for 2020

For 2020 and over the long term, ENGIE anticipates an economic net debt8/EBITDA ratio below or equal to 4.0x and remains committed to a strong investment grade rating.


For 2022, ENGIE anticipates net recurring income, Group share to grow at a CAGR9 range of 6-8% (i.e. between EUR3.2 and 3.4 billion). This guidance is based on an indicative CAGR9 range for EBITDA between 2-4% and for COI between 4-6%. 


For the 2020-2022 period, ENGIE expects to invest EUR 10 billion7 in growth, EUR 8 billion in maintenance and EUR 4 billion in the Synatom financial Capex for the full funding of the nuclear waste provision by 2025. Disposals are expected to amount to EUR 4 billion, primarily aiming at further reducing CO2 emissions and simplifying geographical footprint and structure.


Dividend policy 

For fiscal year 2019, ENGIE confirms the payment of a EUR 0.80 per share dividend representing a payout ratio of 72%, payable in cash


The annual dividend will be paid at one time, after the Ordinary General Meeting (OGM) approving the annual accounts.


For the future, ENGIE confirms the medium-term dividend policy, in the range of 65 to 75% NRIgs payout ratio. 


*************************************

The presentation of the Group’s financial results as of December 31, 2019 used during the investor conference call is available to download from ENGIE’s website.


The Group’s consolidated accounts and the parent company financial statements for ENGIE SA as of December 31, 2019 were approved by the Board of Directors on February 26, 2020. ENGIE’s statutory auditors have performed their audit of these accounts. The relevant audit report is currently being issued. 


The complete notice of the Annual General Meeting, draft resolutions and Board of Directors’ report will be published in the second half of March.
 

UPCOMING EVENTS
Contributive revenues

Revenues for France increased by 4.8% on a gross basis and by 3.2% on an organic1 basis.


For France excluding Infrastructures, revenues increased by 5.7% on a gross basis and by 4.4% on an organic1 basis. The higher gross increase than the organic1 increase is explained by the acquisition of several companies in the Client Solutions activities. The organic1 increase was mainly due to higher sales in Client Solutions activities (installations, construction and energy efficiency) as well as in retail power supply and is partly offset by lower hydroelectric power generation and by lower gas sales volumes (due to a negative temperature effect and a reduction of the customer base in retail gas supply).


For France Infrastructures, revenues increased by 2.2% on a gross basis and were flat on an organic1 basis. The organic1 variation was due to the outsourcing of LNG activities as well as to the tariff increases in distribution and in transmission, although limited by tariff smoothing and less subscribed capacity, this increase is partly offset by gas storage with a reduction in purchase/sale operations in France as a result of the new regulatory framework implemented in 2018. 


Revenues for Rest of Europe were up 1.9% on a gross basis and 2.4% on an organic1 basis.
Organic1 growth was driven mainly by Supply activities in Benelux (fueled by positive price effects) and in Romania, by Client Solutions activities in Belgium (notably on installation and energy efficiency) and in Spain (mainly on installation), by Nuclear recovery both in volumes and price, whereas Thermal activities revenues decreased.
The lower gross increase than the organic1 increase is explained by the divestment in retail BtoB Supply German portfolio in 2018, only partly offset by contributions of several tuck-in acquisitions in Central Europe (notably OTTO in Germany).


Revenues for Latin America increased by 15.1% on a gross basis and by 10.9% on an organic1 basis.
Gross growth includes the positive impact of the integration of a Client Solutions service company (CAM) acquired at the end of 2018, partially offset by a globally unfavorable foreign exchange effect, driven by the depreciation of the Argentinian peso (- 36%) and the Brazilian real (- 2%), only partially compensated by the appreciation of the US dollar (+ 6%), Mexican peso (+ 5%) and Peruvian sol (+ 4%) against euro. In Chile, the business was positively impacted by the ramp up of long-term PPAs, and in Brazil, organic1 growth was mainly due to the commercial commissionings of new wind and solar farms, a new thermal unit and to the effect of inflation on PPA contracts.


Revenues for USA & Canada were up 35.5% on a gross basis and 10.1% on an organic1 basis benefiting from positive scope effects due to the contribution of acquisitions in Client Solutions (Donnelly, Unity, Systecon and Conti) and in power Supply activities (Plymouth Rock) in the US and a positive foreign exchange effect due to the appreciation of the US dollar against euro. The organic1 growth was mainly due to a positive price effect in the power BtoB Supply activities in the US.


Revenues for Middle East, Africa & Asia were down 27.4% on a gross basis and 6.7% on an organic1 basis.
The higher gross decrease is mainly due to the negative scope effect of the disposal of Glow (Thailand) in March 2019, partly offset by acquisitions in Client Solutions in Asia and in the Middle East (Cofely BESIX) as well as by positive foreign exchange effects mainly linked to the appreciation of the US dollar against euro. On an organic1 basis, Supply showed a lower performance (mainly in Australia) and Client Solutions activities delivered lower revenues in Africa and Australia.


Revenues for the Others segment increased by 13.2% on a gross basis and by 7.5% on an organic1 basis.
This increase was mainly due to GEM fueled by growth in international activities and gas contracts renegotiation and to Supply benefiting from a favorable market context for business customers in France.
 

Contributive revenues, after elimination of intercompany operations, by business line
APPENDIX 2: COMPARABLE BASIS ORGANIC1 GROWTH ANALYSIS

The calculation of organic1 growth aims to present comparable data both in terms of the exchange rates used to convert the financial statements of foreign companies and in terms of contributing entities (consolidation method and contribution in terms of comparable number of months). Organic1 growth in percentage terms represents the ratio between the data for the current year (N) and the previous year (N-1) restated as follows:

  • The N-1 data is corrected by removing the contributions of entities transferred during the N-1 period or pro rata temporis for the number of months after the transfer in N.
  • The N-1 data is converted at the exchange rate for the period N.
  • The N data is corrected with the N acquisition data or pro rata temporis for the number of months prior to the N-1 acquisition.


Important notice 

The figures presented here are those customarily used and communicated to the markets by ENGIE. This message includes forward-looking information and statements. Such statements include financial projections and estimates, the assumptions on which they are based, as well as statements about projects, objectives and expectations regarding future operations, profits, or services, or future performance. Although ENGIE management believes that these forward-looking statements are reasonable, investors and ENGIE shareholders should be aware that such forward-looking information and statements are subject to many risks and uncertainties that are generally difficult to predict and beyond the control of ENGIE, and may cause results and developments to differ significantly from those expressed, implied or predicted in the forward-looking statements or information. Such risks include those explained or identified in the public documents filed by ENGIE with the French Financial Markets Authority (AMF), including those listed in the “Risk Factors” section of the ENGIE (ex GDF SUEZ) reference document filed with the AMF on March 20, 2019 (under number D.19-0177). Investors and ENGIE shareholders should note that if some or all these risks are realized they may have a significant unfavorable impact on ENGIE.


Footnotes

1 Organic variation: gross variation without scope and foreign exchange effect.
2 These targets and this indication assume average weather conditions in France, full pass through of supply costs in
French regulated gas tariffs, no significant accounting changes, no major regulatory or macroeconomic changes,
commodity price assumptions based on market conditions as of December 31, 2019 for the non- hedged part of the
production, no change in the nuclear provision legal and regulatory framework, average foreign exchange rates as follows for 2020: EUR/USD: 1.13; EUR/BRL: 4.57 and for 2021-2022: EUR/USD: 1.16; EUR/BRL: 4.57 and dilution from the €4 bn disposal plan for 2020-22.
3 2018 Figures adjusted for IFRS 16
4 In Q4 2019, the Group has implemented a new IFRS pronouncement related to commodity derivatives and requiring a change in presentation of Revenues with no impact on other performance indicators. For comparability with previous communications, Adjusted revenues are also provided based on the former definition. For more information please refer to Note 1 to the 2019 consolidated financial statements.
5 Cash flow from operations = Free Cash Flow before maintenance Capex.
6 DBSO – Develop, Build, Share & Operate.
7 Net of DBSO partial sell-downs.
8 Economic net debt amounted to EUR 41.1 billion at the end of December 2019 (compared with EUR 35.7 billion at the end of December 2018); it includes, in particular, nuclear provisions and post-employment benefits.
9 CAGR: Compound Annual Growth Rate.