

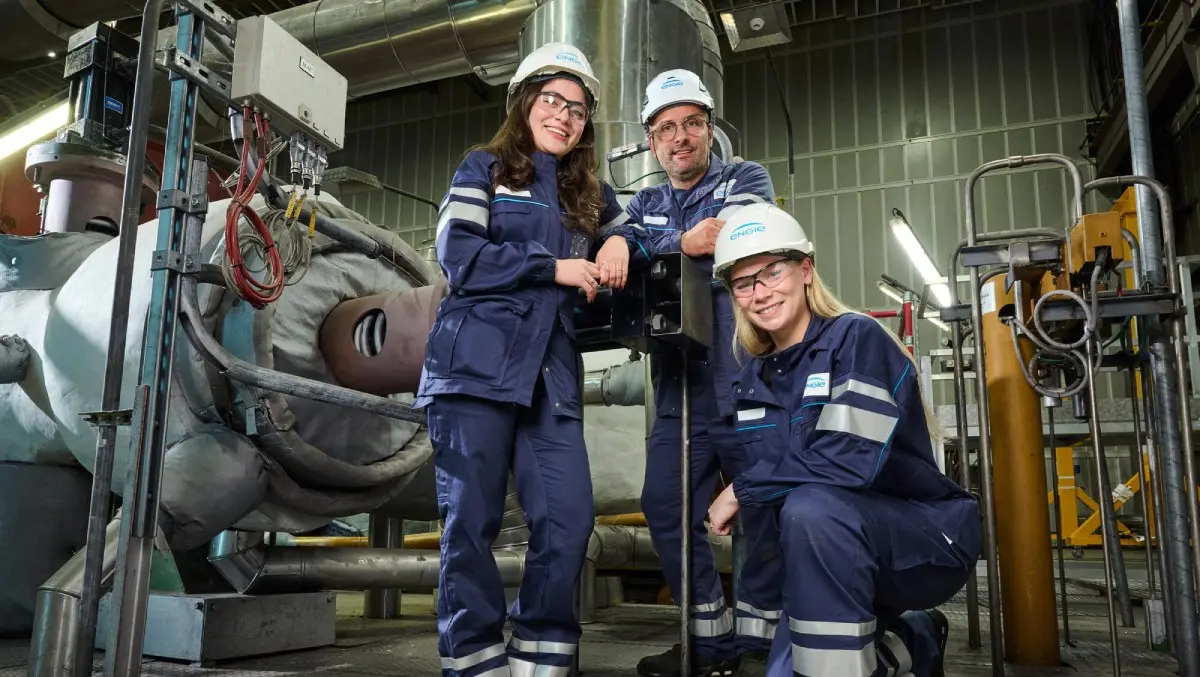



Green bonds issued between September 2023 and June 2024
Green Bond – June 2024
Final Terms for the € 800,000,000 NC6 green hybrid (including the Use of Proceeds clause)
12.06.2024 – 451 Ko
Final Terms for the € 1,035,000 NC9 green hybrid (including the Use of Proceeds clause)
12.06.2024 – 452.4 Ko
Green Bond – March 2024
Final Terms for the € 800,000,000 tranche maturing March 2031 (including the Use of Proceeds clause)
04.03.2024 – 451 Ko
Final Terms for the € 600,000,000 tranche maturing March 2044 (including the Use of Proceeds clause)
04.03.2024 – 348.1 Ko
Green Bond – December 2023
Final Terms for the € 900,000,000 tranche maturing December 6, 2033 (including the Use of Proceeds clause)
04.12.2023 – 428.1 Ko
Green Bond – September 2023
Final Terms for the € 900,000,000 tranche maturing September 6, 2042 (including the Use of Proceeds clause)
04.09.2024 – 550.4 Ko
A summary of the amount of proceeds allocated from green bonds in 2024 is presented below:

The main eligible green projects financed with the proceeds of the green bond issues carried out between September 2023 and June 2024 that meet the conditions of the June 23 Green Financing Framework are listed in the following table:


The projects (and the related capex) set out in the table above for a total of €3.14 billion are allocated to the green bond issued between September 2023 and June 2024; in proportions enabling the senior green bonds issued between September 2023 and March 2024 and the PNC6 hybrid bond to be fully allocated, and the PNC9 hybrid bond issued in June 2024 to be partially allocated.
The funds allocated to the eligible green projects in 2024 include €3 billion for investments made in 2024 (including €248.9 million in financial capex for the acquisition of pure-players, and €200.7 million in maintenance capex), €107.7 million for investments made in 2023, and €20.4 million for investments made in 2022.
1. Renewable energy production
A total amount of €2 billion was allocated to eligible green projects related to renewable energy production.
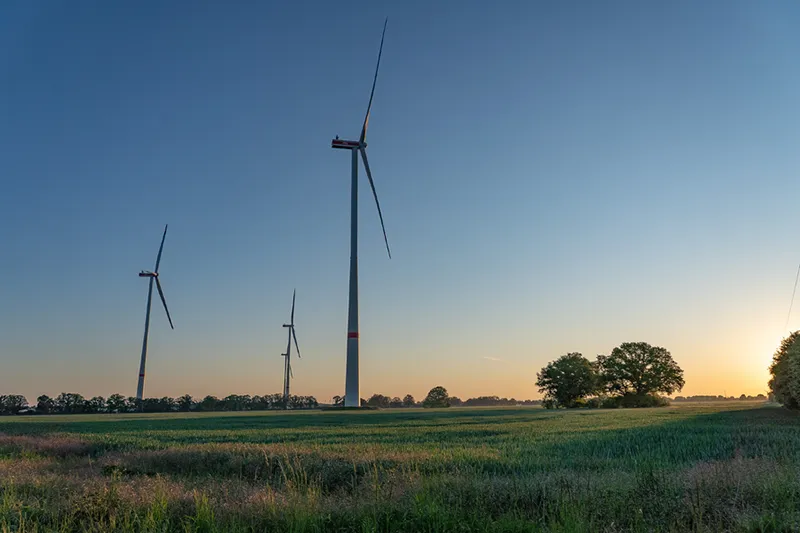
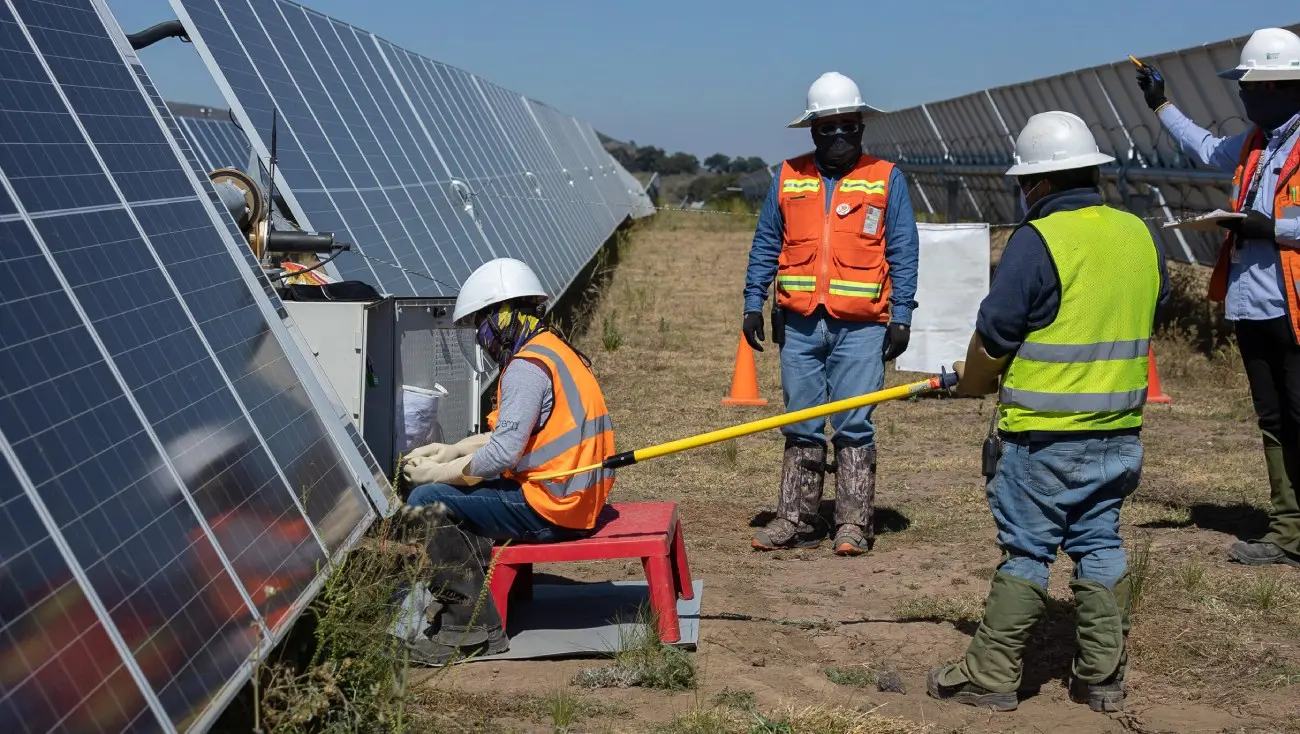
At the end of 2024, the Group’s installed electricity production capacity, taken at 100%, represented 43% of its total installed capacity. ENGIE continued expansion of renewable assets, mainly wind and solar, and investments in offshore wind via the joint venture, Ocean Winds.
With respect to renewable gases, in addition to the various projects developed in France by its subsidiary ENGIE BiOZ, the Group also acquired several biomethane producers in Europe (Belgium, the Netherlands and the UK).
2. Energy storage
total amount of €765.4 million was allocated to eligible green projects relating to energy storage.
The green eligible projects in question include:
- power battery storage projects in Belgium, the Netherlands, the UK and the United States, either independent or co-located with a renewable energy production asset;
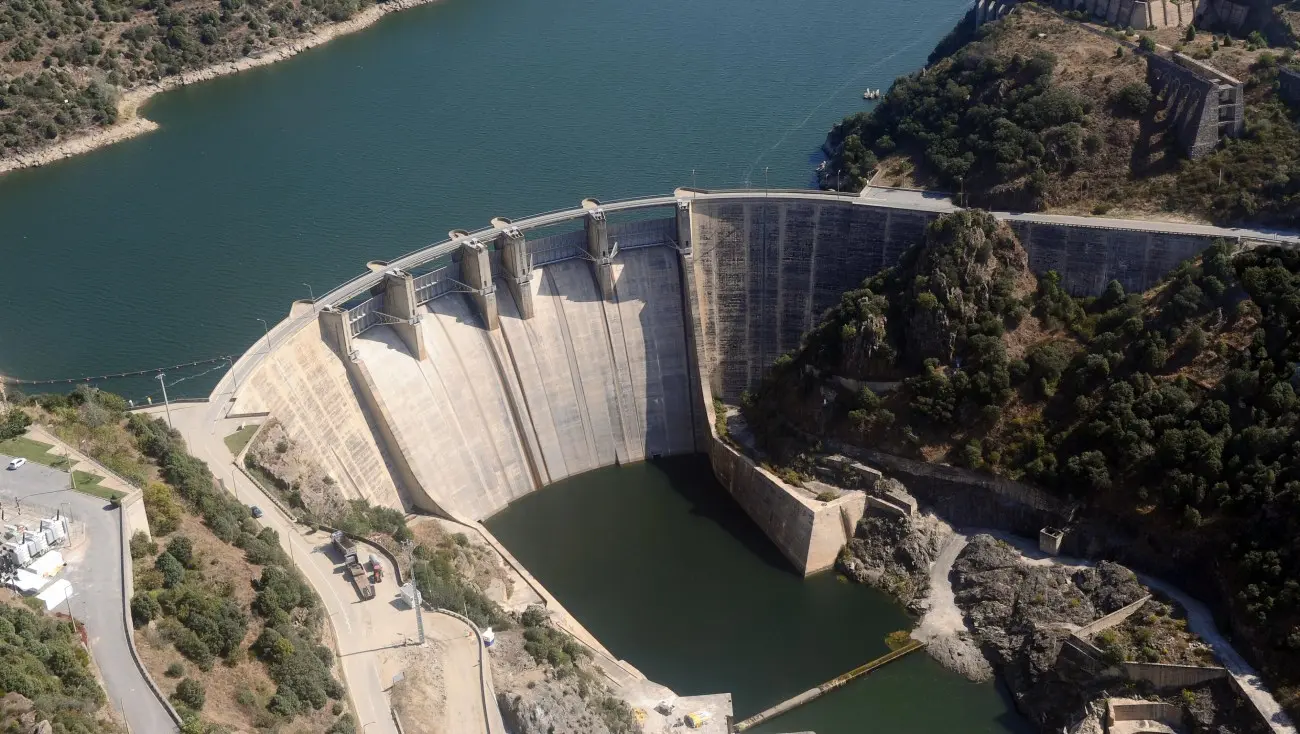
- the Dinorwig (1,728 MW) and Ffestiniog (360 MW) pumped storage facilities in the United Kingdom, owned and operated by First Hydro, which is 75% owned by ENGIE;
- the Coo pumped storage plant (Belgium), where investments are being made to expand its storage facilities to increase its installed power by 79 MW;
3. Transmission and distribution infrastructure
A total of €128.3 million was allocated to eligible green projects in this domain.
4. Energy efficiency
A total of €108.3 million was allocated to eligible green projects relating to energy efficiency.
5. Clean mobility
A total amount of €147.5 million was allocated to eligible green projects relating to low-carbon mobility.
Impact reporting
The impact reporting only takes into account the new projects listed above. Reallocated projects following the buyback of previous issues are excluded.
In the full operation phase, projects are expected to contribute to avoid 2.63 million tons of CO2 eq. per year:
- for renewable projects: 2.24 million tons of CO2 eq./year
- for storage projects: 0.03 million of CO2 eq./year
- for energy efficiency projects: 0.36 million tons of CO2 eq./year
Technological and regional breakdowns of the impacts in tons of CO₂ eq. per year of the projects are presented below (at 100%).

The contributions to avoided emissions are presented in the following table, using different weighting methods:
a) at 100% regardless of the Group’s ownership rate and the nature of the capex
b) according to the Group’s ownership rate and regardless of the nature of the capex
c) at 100% considering only the development capex
d) according to the Group’s ownership rate and taking only the development capex
| (a) linked to all capex at 100% | b) linked to all capex at % of ownership | c) linked to development capex at 100% | d) linked to development capex at % of ownership | |
|---|---|---|---|---|
| Wind power | 498,315 | 285,893 | 458,790 | 269,419 |
| Solar Power | 1,331,110 | 663,121 | 1,329,823 | 661,834 |
| Geothermal | 58,603 | 42,776 | 58,603 | 42,776 |
| HydroBioenergy | 352,132 | 230,707 | 274,343 | 152,918 |
| Hydro | ||||
| Energy storage | 29,752 | 29,515 | 29,752 | 29,515 |
| Renewable gas | ||||
| Hydrogen | 2,638 | 2,638 | 2,638 | 2,638 |
| Energy efficiency | 354,905 | 304,645 | 354,905 | 304,645 |
| Clean mobility | ||||
| Total | 2,627,456 | 1,880,106 | 2,508,854 | 1,777,416 |
Green bonds issued / associated allocations and impact
Green bonds issued in 2026
Green bonds issued between October 2024 to October 2025
Green bonds issued between September 2023 and June 2024
Green bonds issued between January and September 2023
Green bonds issued between October 2021 and September 2022
Green bonds issued between March 2020 and July 2021
Green bonds issued between June and October 2019
Green bond issued in January 2019
Green bond issued in January 2018
Green bond issued in September 2017
What do you want to do?