

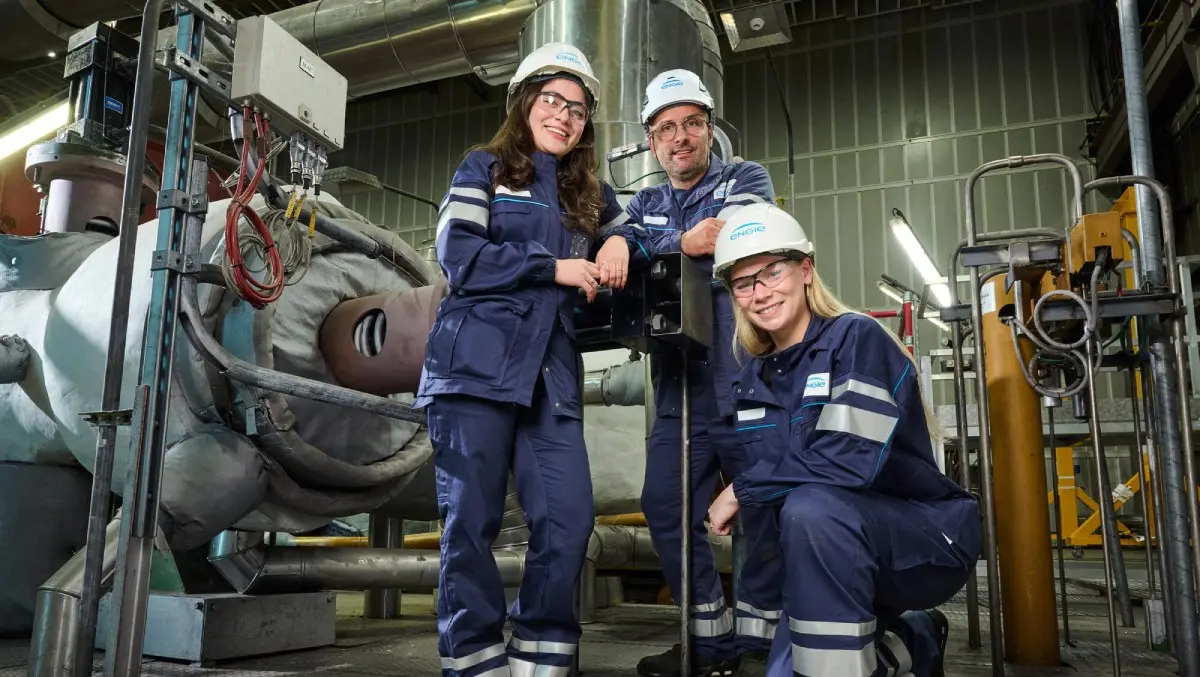



Green bond issued in March 2017
Green Bond – September 2017
ENGIE Green Bond september 2017 – Framework applicable to Green Bond issuance from 15th of March 2017
15.03.2017 – 676.4 Ko
ENGIE Green Bond 2017 – Second Opinion of Vigeo Eiris (September 2017)
17.09.2017 – 656.4 Ko
Final Terms for the tranche of 750 million of euros maturing February 28, 2029 (including the Use of Proceeds clause)
26.09.2017 – 656.4 Ko
Final Terms for the tranche of 500 million of euros maturing February 28, 2023 (including the Use of Proceeds clause)
26.09.2017 – 252 Ko
The total funds allocated under this issue to eligible projects developed during the years 2016 and 2017 amount to 81 million euros and 1,419 million euros respectively. These amounts make it possible to allocate €1,500 million, i.e. the total amount of the green bond issued in March 2017. The March 2017 green bond contributed to financing and acquiring eligible renewable energy and energy efficiency projects.
| Project type | Technology | Region | Project name | Country | CAPEX (in million euros) |
|---|---|---|---|---|---|
| Renewable | Wind | Europe | Projets de CN’AIR, ENGIE Green, LCV) | France | 293 |
| Moray | UK | ||||
| South America | Campo Largo | Brazil | |||
| North America | Très Mesas | Mexico | |||
| Oceania | Willogoleche | Australie | |||
| Solar | Europe | Solaire Direct, Projets de ENGIE Green, CN’AIR, LCV | France | 72 | |
| South America | Paracatu, Floresta (1) | Brazil | |||
| Biomass | Europe | Macon | France | 47 | |
| Sissleerfeld | Switzerland | ||||
| Global capex in million euros for renewable energy projects | 412 | ||||
| Energy Efficiency | District cooling | Asia | Tabreed | Emirats Arabes Unis | 657 |
| Energy Efficiency | North America | Green Charge | USA | 51 | |
| Ohio State university | USA | 126 | |||
| Europe | Keepmoat | UK | 146 | ||
| Smart Grid (GAZPAR) | France | 78 | |||
| South America | Salto Santiago | Brazil | 9 | ||
| Divers | 21 | ||||
| Global capex in million euros for energy efficiency projects | 1,088 | ||||
| Total | Global capex in million euros | 1,500 | |||
Solar and wind projects in France
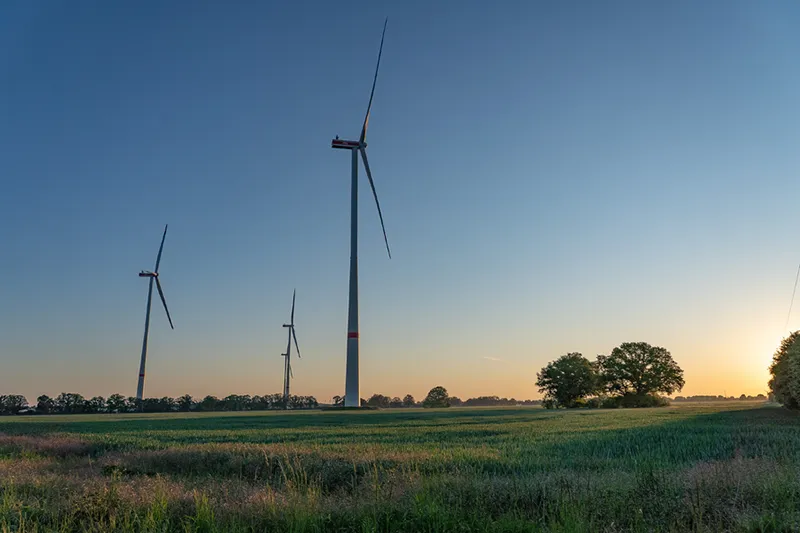
As a major player in renewable energy production in France, ENGIE is committed to the energy transition and the development of renewable projects. The allocated capex relate to the wind and solar projects of its fully owned subsidiary ENGIE Green (resulting from the merger of Futures Énergies and Maia Eolis in 2016 and LCV – La Compagnie du Vent in 2017) and its subsidiary CNR (Compagnie Nationale du Rhône – 49.9%) itself acting through its subsidiary CN’Air (hydroelectricity, onshore wind and solar photovoltaic) for a total installed capacity of 142 MW in wind and 36 MW in solar. Also worth noting are the two offshore wind projects in Dieppe/Le Tréport and l’Île d’Yeu/Noirmoutier (2 x 500 MW in capacity, projects 47% owned by ENGIE). The 2016 financial capex relating to the buyout of minority interests in Solaire Direct has also been included.
Wind (Campo Largo) and solar (Floresta and Paracatu) projects in Brazil
ENGIE, which is the main private electricity producer in Brazil (about 6% of the country’s installed capacity), is continuing its development through new renewable energy production projects. Renewable energy represents 90% of its installed capacity in Brazil. Projects under construction and financed by the green bond include the Campo Largo onshore wind farm (327 MW), as well as the Floresta (86 MW) and Paracatu (132 MW) solar farms.
Offshore project (UK)
In September 2011, the Group won a contract with the Portuguese company EDP Renováveis to develop a 950 MW offshore wind farm in the United Kingdom. ENGIE’s stake: 23%.
Onshore wind project in Australia
ENGIE began pre-construction work in 2017 on the 119 MW Willogoleche wind farm near Hallett in the Mid North region of South Australia. ENGIE’s shareholding in this project is 72%.
Biomass project
Two cogeneration projects to supply heating networks and operating in biomass co-combustion were integrated into the green bond of March 2017 (Mâcon in France – 100% ENGIE, and Sisslerfeld in Switzerland – 60% ENGIE) for an injected biomass estimated at 230 GWh.
Tabreed (United Arab Emirates)
In July 2017, ENGIE bought a 40% stake in Tabreed (National Central Cooling Company PJSC), which provides innovative cooling solutions for buildings and other infrastructure to the United Arab Emirates and the member countries of the Gulf Cooperation Council (GCC). The company delivers the equivalent of over 1 million tons of cooling to its clients across 71 district cooling plants located throughout the region, replacing individual refrigeration systems with solutions that are 40% more efficient.
Ohio State University project (USA)
In April 2017, ENGIE (50%) and Axium Infrastructure US (50%) won a 50-year concession to sustainably manage Ohio State University’s energy infrastructure. The contract covers the operation and optimization of the university’s energy production and distribution facilities, and energy efficiency services to reduce energy consumption by 25% within the first 10 years of the contract.
Keepmoat (UK)
In March 2017, ENGIE acquired Keepmoat Regeneration, the UK’s leading provider of regeneration services, improving buildings, places and communities through refurbishments and upgrades. Keepmoat has extensive capabilities in creating zero carbon new homes, retrofitting high-rise residential accommodation and supporting the cost reduction and energy efficiency targets of community regeneration projects, such as insulation and heating solutions, on-site generation, and energy consulting services. Energy savings were estimated using statistical data based on installed technology. Most of the savings were generated from heat insulation with an estimated efficiency of 20%.
Green Charge project (USA)
In 2016, ENGIE acquired an 80% stake in California-based battery power storage company Green Charge Networks (Green Charge). It uses advanced patented software algorithms and analytics to optimize battery systems at commercial and industrial (C&I) and public sector customer sites in the United States. These systems generate financial and environmental benefits by storing energy from an efficient system (generally combined cycles) and avoiding the use of less efficient peak systems, considered 40% less energy efficient.
Smart Grid project (Gazpar – France)
Since January 2016, more than 160,000 smart meters have been installed in 24 pioneering municipalities. The general roll-out of these gas meters began in May 2017 and will gradually be extended to all metropolitan regions of France, benefiting approximately 11 million customers. The smart gas meter allows customers to monitor and better control their consumption. A technical and economic study carried out under the supervision of the French Energy Regulation Authority (“CRE”) based on the GRDF scope, estimated the total potential energy savings from the installation of these smart meters at 1.5%.
Impact reporting
For CDM (Clean Development Mechanism) projects registered and approved by the United Nations, the results of the calculations are based on the underlying methodologies:
| PROJECTS | Avoided emissions TCO2/AN | RÉFÉRENCE UNFCCC |
|---|---|---|
| Campo Largo | 778,493 | CPA 10286-0005 : Campo Largo Wind Complex (Phase 1) |
| Floresta | 119,806 | CPA 10286-0003 : Floresta Solar Power Complex |
| Paracatu | 161,341 | CPA 10286-0004 : Paracatu Solar Power Complex |
In the full operation phase, the projects are expected to contribute to avoid emissions of at least 3.3 million tons of CO2eq. per year:
- for renewable projects, a minimum of 2.2 million tons of CO2 eq./year;
- for energy efficiency projects, a minimum of 1.1 million tons of CO2 eq./year.
Technology and regional breakdowns of the impacts, in tons of CO₂ eq. per year, of the projects financed by the green bond of March 2017 are set out below (at 100%).

Contributions to reduced or avoided emissions are presented in the following table using different weighting methods:
a) at 100% regardless of the Group’s ownership rate and the nature of the capex
b) according to the Group’s ownership rate and regardless of the nature of the capex
c) at 100% considering only development capex
d) according to the Group’s ownership rate and taking only the development capex
| Contribution to avoided and reduced CO2Emissions (T C02 eq/year) | ||||
|---|---|---|---|---|
| a) linked to development and financial CAPEX taken at 100% | b) linked to development and financial CAPEX taken at % of ownership | c) linked to development CAPEX taken at 100% | d) linked to development CAPEX taken at % ownership | |
| Solar | 313,001 | 313,001 | 282,099 | 282,099 |
| Wind | 1,867,418 | 963,773 | 1,058,029 | 752,047 |
| Biomass | 36,601 | 34,404 | 36,601 | 34,404 |
| District systems | 675,814 | 285,985 | 30,024 | 27,668 |
| Efficiency | 450,189 | 322,963 | 182,088 | 170,086 |
| TOTAL | 3,343,023 | 1,920,126 | 1,588,841 | 1,266,305 |
ENGIE favours the first method because of its major industrial role in the development of these projects, which means that it does not modify its impact reporting in the event of a sale. However, the contributions calculated using the three alternative methods are presented at the request of some investors.
Green bonds issued / associated allocations and impact
Green bonds issued in 2026
Green bonds issued between October 2024 to October 2025
Green bonds issued between September 2023 and June 2024
Green bonds issued between January and September 2023
Green bonds issued between October 2021 and September 2022
Green bonds issued between March 2020 and July 2021
Green bonds issued between June and October 2019
Green bond issued in January 2019
Green bond issued in January 2018
Green bond issued in September 2017
What do you want to do?