




Green bond issued in January 2019

Green Hybrid Bond – January 2019
ENGIE Green Bond Framework applicable to Green Bond issuance from 17th of January 2019
17.01.2019 – 206.1 Ko
Second party opinion of Vigeo Eiris
16.01.2019 – 722.3 Ko
Final Terms for the €1,000,000,000 tranche maturing February 28, 2025 (including the Use of Proceeds clause)
15.05.2014 – 199.6 Ko
The main eligible projects that were financed in 2019 with the proceeds of the January 2019 green bond issue are presented in the following table.
| Project type | Technology | Region | Projects name | Country | CAPEX (in million euros) |
|---|---|---|---|---|---|
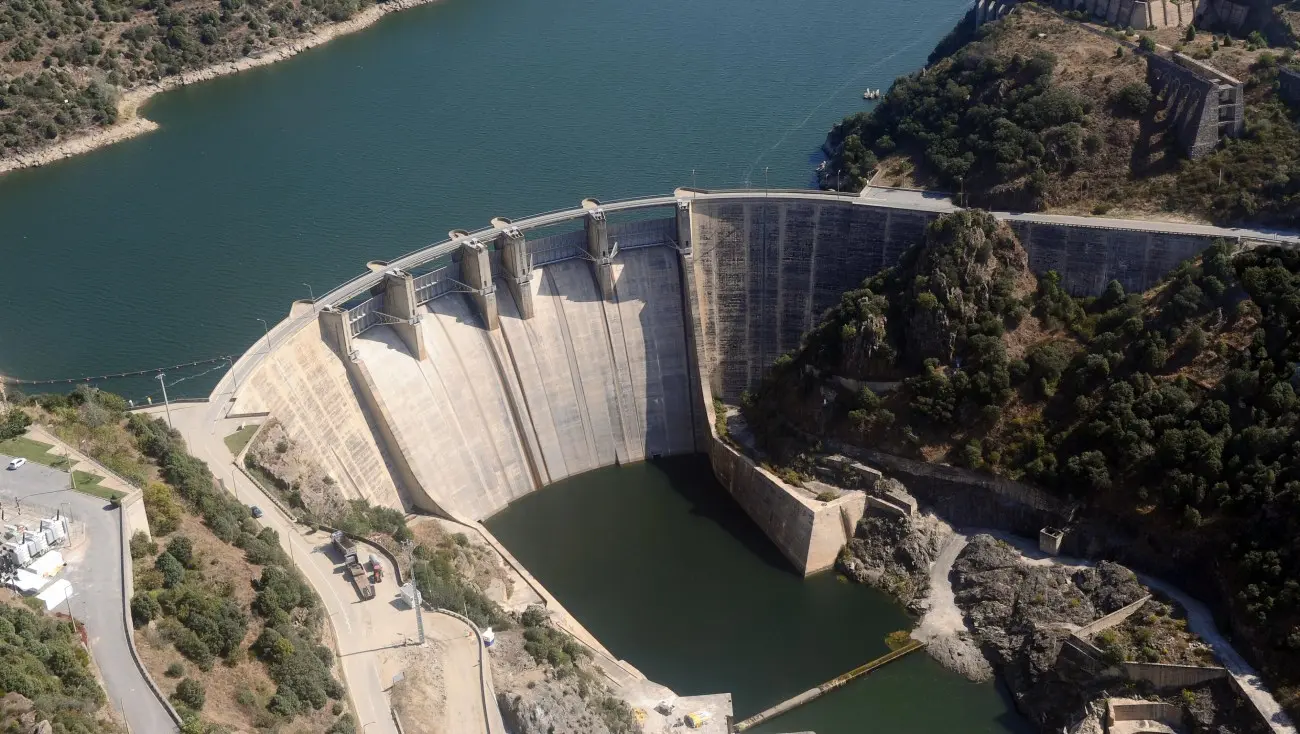
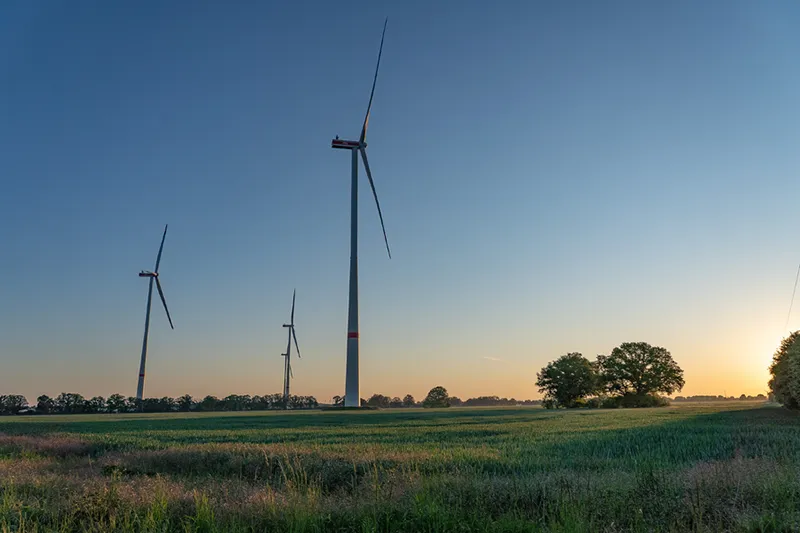
| Renewable | Wind | Europe | Projects of CN’AIR, ENGIE Green, LANGA et Saméole | France | 451 |
| Windfloat | Portugal | ||||
| North America | King Plains, Las Lomas, Live Oak(1), Dakota Range III, Prairie Hill, Triple H, Solomon Forks(1) | United States | |||
| Asia and Oceanie | Willogeleche(1) | Australia | |||
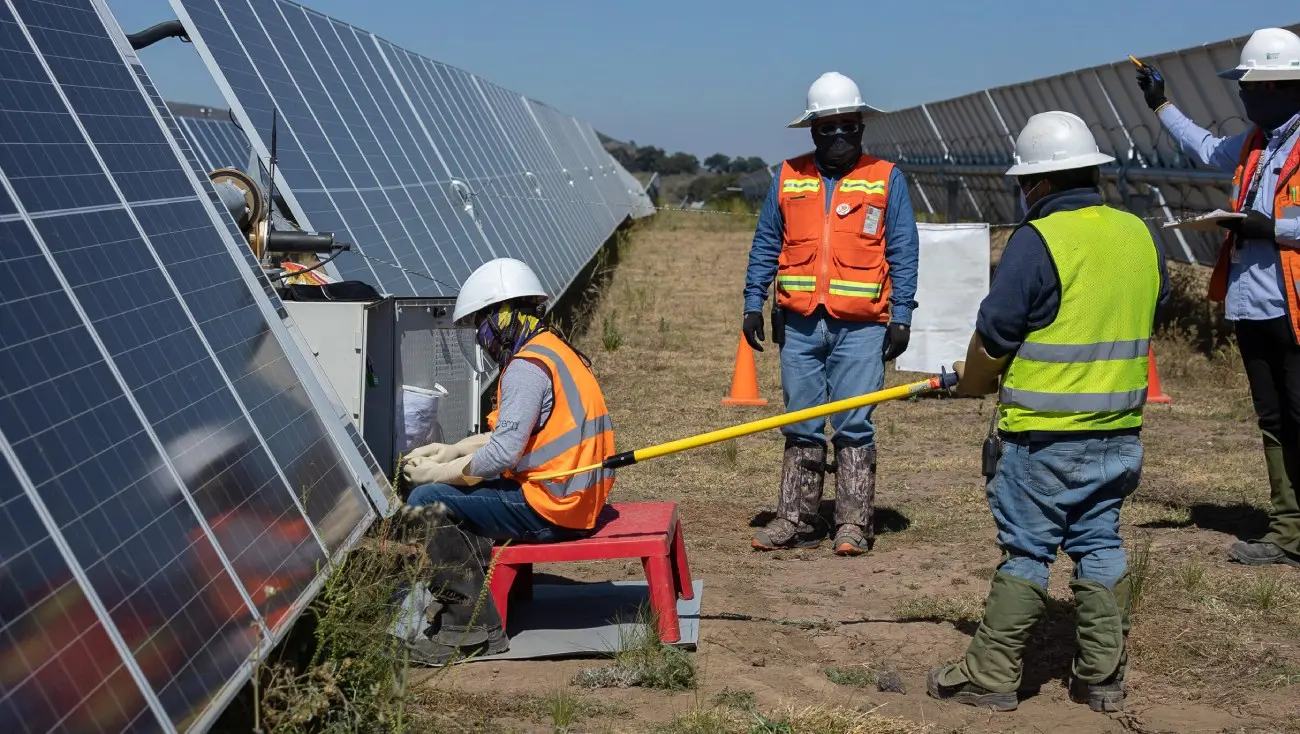
| Solar | Europe | Projects of CN’AIR, ENGIE Green, LANGA | France | 90 | |
| North America | Anson, Bluestone, Gretna, Long Draw | United States | |||
| Asia and Oceanie | Lifou, Kota-bore, Lavaghu, Koumac | Nouvelle Calédonie | |||
| Biomass-biogas | Europe | VolV biomass | France | 93 | |
| DSP Macon(1), DSP Bordeaux | |||||
| Biogaz injector | |||||
| Geothermal | Asia and Oceanie | Muara Laboh(1) | Indonesia | 13 | |
| R&D | Europe | France | 46 | ||
| Global capex in million euros for renewable energy projects | 693 | ||||
| Energy efficiency | District heating system | Europe | Projects of ENGIE Réseaux | France | 4 |
| District cooling system | Europe | Projects of Climespace(1) | France | 6 | |
| Energy efficiency | Europe | CertiNergy & Solutions | France | 81 | |
| R&D | Europe | France | 47 | ||
| Global capex in millions of euros for energy efficiency projects | 138 | ||||
| Clean Mobility | Clean Mobility | Europe | ChargePoint | United Kingdom | 165 |
| Powerlines | Germany | ||||
| GNVvert | France | ||||
| EV Box(1) | The Netherlands | ||||
| South America | Transantiago(1), Los Andes Rent a Car | Chili | |||
| R&D | Europe | France | 4 | ||
| Global capex in millions of euros for clean mobility projects | 169 | ||||
| Total | Global capex in million euros | 1000 | |||
| (1) Eligible projects having received an allocation in previous Green Bonds | |||||
The main new projects concern the development of solar and wind farms in France and North America. The Group has also acquired Vol-V Biomasse thus becoming the leading biomethane producer in France, with the aim of accelerating the development of this sector in France. The main project allocated in terms of energy efficiency is the acquisition of CertiNergy, which reinforces the Group’s position on energy saving certificates to accelerate the energy transition of companies and communities. In terms of mobility, the green bond of January 2019 has enabled ENGIE to finance various projects presented in the following link (Clean Mobility) and in particular the acquisition of Powerlines, which enables the Group to become a major player in the electrification of rail networks in Europe.
Impact reporting
In the full operation phase, the projects are expected to contribute to avoid emissions of at least 3.43 million tons of CO2 eq. per year:
- for renewable projects, a minimum of 3.02 million tons of CO2 eq./year;
- for mobility projects, 0.04 million tons of CO2 eq./year;
- for energy efficiency projects, a minimum of 0.37 million tons of CO2 q./year.
Breakdowns by technology and region of the impacts in tons of CO₂ eq. per year of the projects financed by the green bond of January 2019 are presented below (at 100%).

Contributions to reduced or avoided emissions are presented in the following table using different weighting methods:
a) at 100% regardless of the Group’s ownership rate and the nature of the capex
b) according to the Group’s ownership rate and regardless of the nature of the capex
c) at 100% considering only development capex
d) according to the Group’s ownership rate and taking only the development capex
| a) linked to development and financial CAPEX taken at 100% | b) linked to development and financial CAPEX taken at % of ownership | c) linked to development CAPEX taken at 100% | d) linked to development CAPEX taken at % ownership | |
|---|---|---|---|---|
| Biomass-biogas | 19,917 | 19,917 | 7,887 | 7,887 |
| District systems | 18,702 | 18,696 | 18,702 | 18,696 |
| Energy efficiency | 350,894 | 350,894 | ||
| Geothermal | 462,485 | 161,870 | ||
| Solar | 317,619 | 82,726 | 317,619 | 82,726 |
| Wind | 2,223,202 | 664,660 | 2,158,423 | 644,579 |
| Mobility | 37,676 | 37,676 | 10,525 | 10,525 |
| TOTAL | 3,430,495 | 1,336,439 | 2,513,156 | 764,412 |
ENGIE favours the first method because of its major industrial role in the development of these projects, which leads it not to modify its impact reporting in the event of a sale. However, the contribution according to the three alternative methods is presented at the request of some investors.
Green bonds issued / associated allocations and impact
Green bonds issued in 2026
Green bonds issued between October 2024 to October 2025
Green bonds issued between September 2023 and June 2024
Green bonds issued between January and September 2023
Green bonds issued between October 2021 and September 2022
Green bonds issued between March 2020 and July 2021
Green bonds issued between June and October 2019
Green bond issued in January 2019
Green bond issued in January 2018
Green bond issued in September 2017
What do you want to do?